We’re thrilled to announce the general availability of Scale Center, a powerful application designed to empower our customers to optimize their Salesforce implementations with enhanced performance and scalability insights. Scale Center revolutionizes the way teams approach development, testing, and monitoring by providing self-serve and near real-time access to Org performance metrics and actionable insights.
In this post, you’ll hear how Salesforce Scale Center helps performance engineers, architects, developers, and admins proactively assess and resolve performance issues in their Salesforce implementations, allowing companies to scale confidently.
The importance of building for scale
Scaling efficiently is a critical aspect of designing and implementing applications on the Salesforce Platform. Many customers only become aware of scalability issues once end users begin to report degraded performance and usability — at this point, these issues have already impacted the business. Designing for the future, and predicting and simulating future business traffic, can be challenging. While some errors can be caught during the design phase, most errors occur only at runtime in production, and sometimes, they manifest during peak loads.
Salesforce Scale Center provides the necessary visibility into performance metrics needed for isolating hotspots, and the ability to deep dive into these hotspots for root cause analysis and remediation guidance. With Salesforce Scale Center, you can now address application scalability proactively instead of reactively ensuring more available, responsive, and performant solutions for your end user.
Gain a comprehensive view of your performance metrics
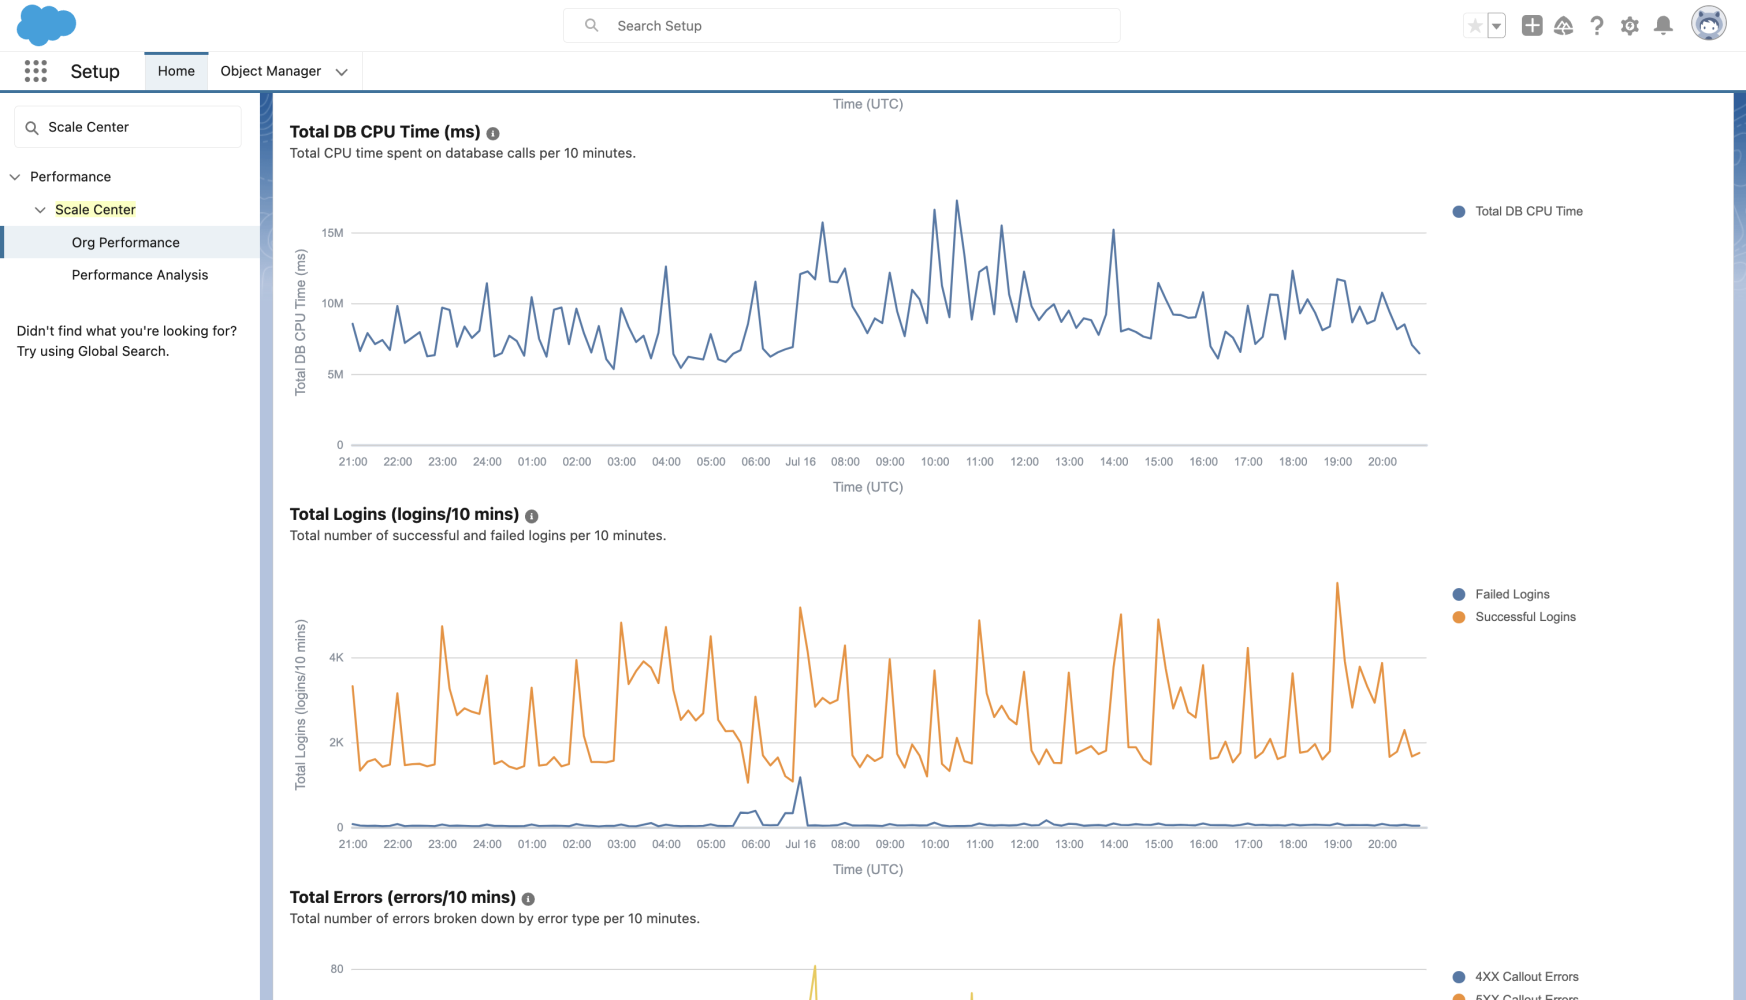
Salesforce Scale Center lets customers see a snapshot of their org performance metrics over a defined time range. Customers are provided with a single pane of glass view into common errors, including failed logins, concurrent Apex errors, and Rowlock errors. Additionally, customers are able to view key metrics visualized in a chart over the duration of the time interval, including Average Request Time, Database CPU Time, and Total Errors. With this view, customers can quickly identify performance and scale hotspots.

Conduct a deep dive analysis into a performance issue
Use Case – Optimizing Database Performance
Salesforce Scale Center doesn’t simply stop at visibility. Once hotspots, issues, and spikes are observed within performance metrics, customers are able to investigate the components and systems that are causing the issue.
Let’s take a look at our first use case: optimizing database performance. Imagine a scenario where end users are reporting that the signup process for your application is taking a significant amount of time and frequently failing. Below, we will walk through how you can address this issue using Salesforce Scale Center.
- Navigate to the Database CPU Chart.
2. On the chart, click and drag to highlight any spikes in performance metrics.

3. Select the report type and initiate a database analysis.


4. Switch to the Performance Analysis tab to view the generated report.

5. Within the report, you can identify the Top SOQL queries by DB CPU Time and DML processes to troubleshoot which specific actions are leading to the poor end user experience.

The available report types in Salesforce Scale Center include: Apex Summary, Concurrent Apex, Database Performance, Flow Performance, Governor Limits, List Views and Reports, Integrations Performance, and Row Lock. Additionally, there is a consolidated report that encompasses all of the analyses.
By following these steps and leveraging the power of Salesforce Scale Center, developers can address performance bottlenecks and optimize processes for improved efficiency.
Compare performance over different time periods
Salesforce Scale Center allows for customers to compare org performance metrics over different time windows. Key use cases include:
- Preparing for production deployment:
- Conduct performance testing in a sandbox environment
- Analyze the test results in Scale Center to identify any bottlenecks or performance issues before deploying to production
- Assessing post-deployment impact:
- After a major release or feature deployment in production, leverage Scale Center to compare org metrics before and after the deployment
- Determine if the deployment has had any detrimental impact on the overall performance of the organization
- Analyzing performance during peak days:
-
- Use Scale Center’s comparison feature to assess the impact on org performance during peak days.
- Compare traffic and performance metrics to baseline behavior, helping to identify any changes or potential issues.
How to Compare Time Periods in Salesforce Scale Center
- Provide a base time range and a comparison time range.

2. Compare top-line metrics.

3. Compare org performance charts.
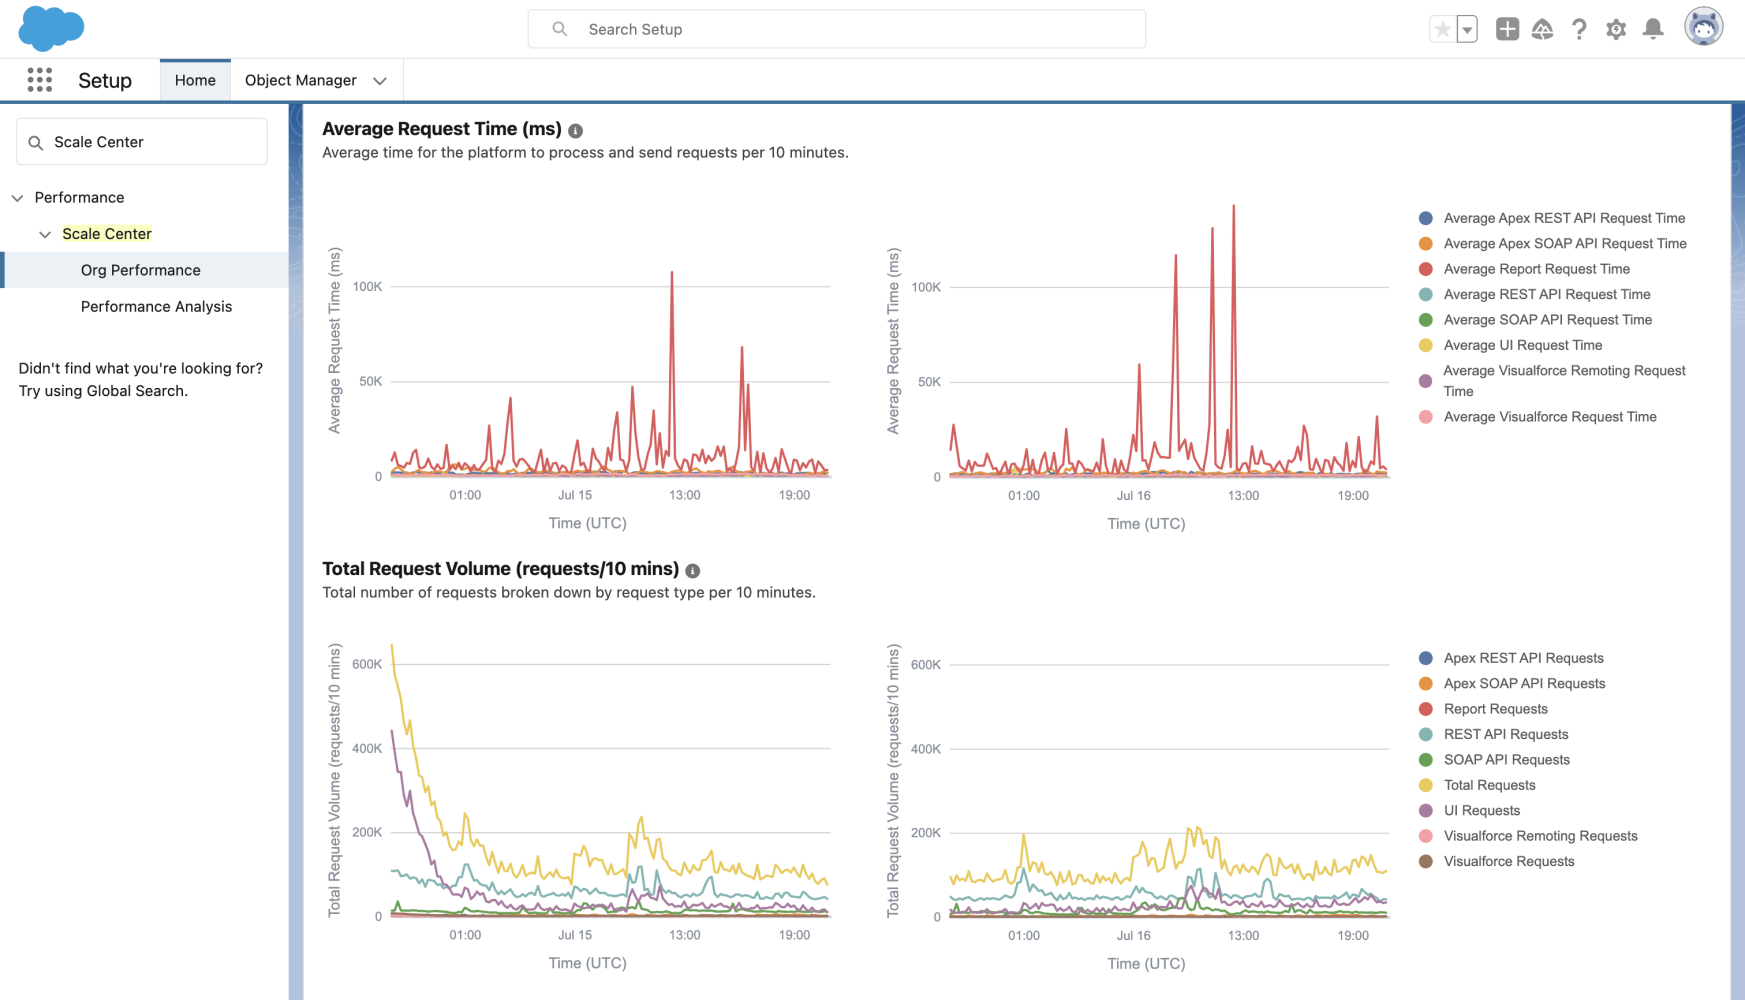
By leveraging Scale Center’s comparison feature, developers can gain valuable insights into org performance, identify areas for optimization, and ensure a smooth and efficient deployment process.
Get started with Salesforce Scale Center
Scale Center is free to use and is accessible in all UE production and full-copy sandbox orgs.
Product considerations:
- Scale Center has no impact on org performance and does not access your org data
- Please note that Scale Center isn’t supported in Government Cloud Plus
- If you would like Scale Center enabled in a non-UE org, please reach out to your account representative
To access Scale Center:
- Navigate to Setup.
- Enter “Scale Center” in the Quick Find box and click on the tab Org Performance under the Performance leaf.
- Enable Scale Center for your org by turning on the Enable Scale Center option.
Please note that it may take up to two hours for performance metrics to appear after enabling Scale Center.
Further Resources
About the author
Justin Saintil is an Associate Product Manager at Salesforce working on the Scalability Products Portfolio.