


Force.com Platform Fundamentals
 j
j
No Results
Search Tips:
- Please consider misspellings
- Try different search keywords
Newer Version Available
Adding Dashboard Components
We haven't yet defined any components, but it's easy to add and reorder them in dashboard builder.
Components come in five varieties.
| Icon | Type | Description |
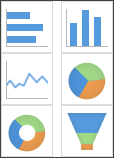 |
Charts | Displays a bar, column, line, pie, donut, or funnel chart—or any chart contained in a report. |
 |
Tables | Displays a table that contains values and totals from columns in the report. |
 |
Metrics | Displays the grand total from a report, along with a label that you enter. |
 |
Gauges | Shows the grand total of a report as a point on a “fuel-tank” type of scale. |
 |
Visualforce Pages | Displays any Visualforce dashboard component in your organization. |