


Force.com Platform Fundamentals
 j
j
No Results
Search Tips:
- Please consider misspellings
- Try different search keywords
Try It Out: Create a Matrix Report
To create the matrix report, we'll use the report builder again, this time highlighting steps that are different from how we defined the summary report.
- In the Reports tab, click New Report.
Once again, we'll be creating a report that counts position records.
- From the list, click the “+” to expand Other Reports.
- Select Positions, and click Create.
Because we want to directly compare individual recruiter performance for positions that do and do not require travel, we'll use a matrix report. That way we can group the rows of positions by recruiter, and columns of positions by whether or not they require travel.
- From the Format drop-down, select Matrix.
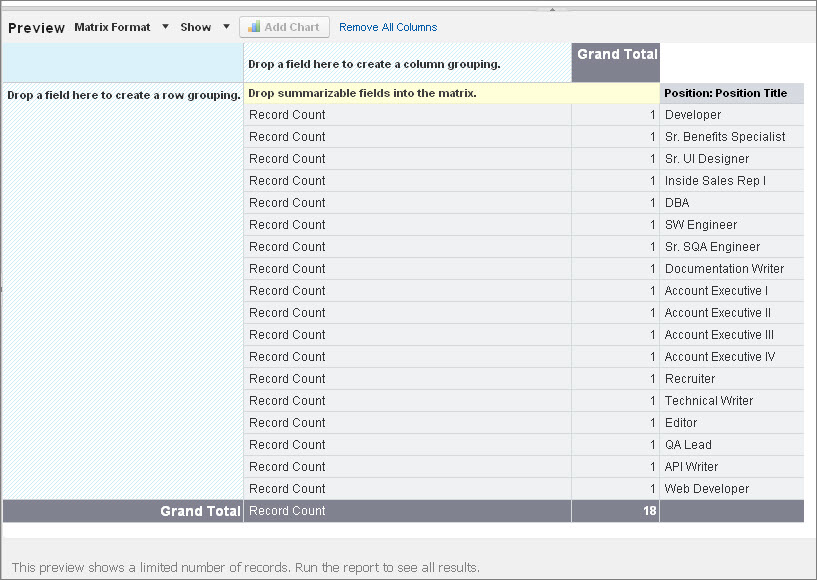
Now let's group by both rows and columns. Notice the two sets of drop zones for matrix reports.
- From the Fields pane, drag Position: Owner Name to the row grouping drop zone.
- Now, drag Travel Required to the column grouping drop zone.
Our report now breaks out the possible values for the Travel Required field in the columns dimension. Recruiters are also broken out in the row dimension, but because all custom reports query just the report creator's data by default (that is, “My” records only), only one recruiter is listed in the report so far. Let's keep going.