Force.com IDE Developer Guide
 j
jGet Started with the Apex Debugger
Nobody likes the idea of looking for a needle in a haystack—or for a
bug in a call stack. We want our tools to facilitate your work and enable your success. And we
haven’t found the debugging experience at Salesforce any more pleasant than you have. Yes,
it’s gotten better over time. Years passed. Winter changed into Spring. Spring changed into
Summer. Summer changed back into Winter. And gradually the Salesforce debugging experience became less
painful. But innovation is in our DNA, and we don’t settle for “less bad.” So, at Dreamforce ’14 we unveiled our gift to you:
a real debugger. At Dreamforce ’15, we
announced that it is generally available. And there was much rejoicing.
| Available in: both Salesforce Classic and Lightning Experience |
| Available in: Enterprise, Performance (one session included), and Unlimited (one session included) Editions |
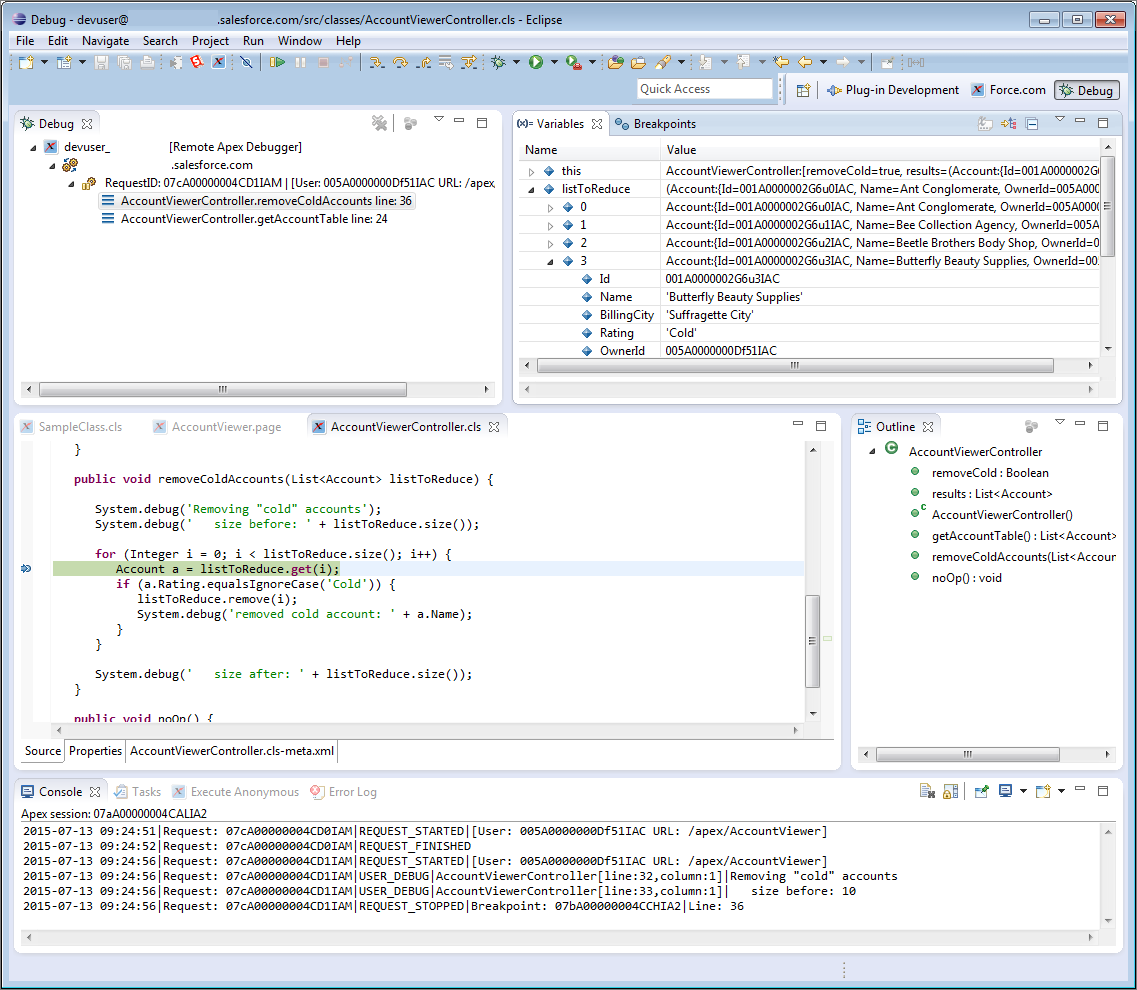
The Apex Debugger extends the Force.com IDE plug-in for Eclipse and
does most of the things you expect a debugger to do. Use it to:
- Set breakpoints in Apex classes and triggers.
- View variables, including sObject types, collections, and Apex System types.
- View the call stack, including triggers activated by Apex Data Manipulation Language (DML), method-to-method calls, and variables.
- Interact with global classes, exceptions, and triggers from your installed managed packages. (When you inspect objects that have managed types that aren’t visible to you, only global variables are displayed in the variable inspection pane.)
- Complete standard debugging actions, including step into, over, and out, and run to breakpoint.
- Output your results to the Console window.