Analytics Extended Metadata (XMD) Reference
 j
jNewer Version Available
Change Display Labels for Dataset Fields and Values
When you change display labels for fields and values, the changes affect only the
appearance in the UI. The changes don’t alter the underlying data stored in the dataset or the
API names of the fields.
You can customize display labels for the following:
- Dimensions, derived dimensions, measures, and derived measures.
- Values in dimensions and derived dimensions.
You cannot customize date labels.
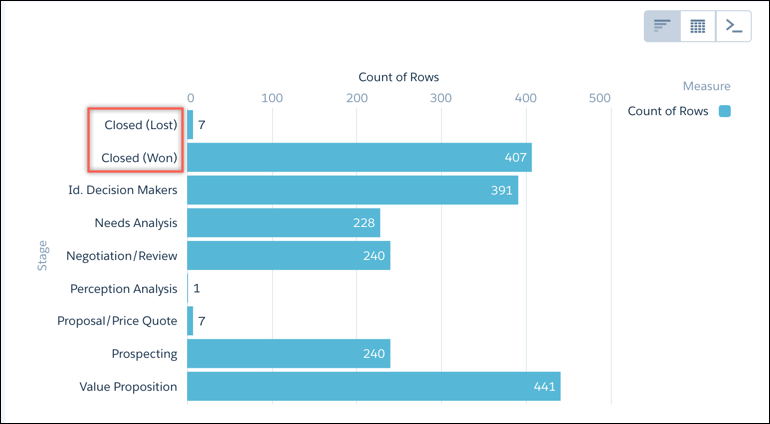
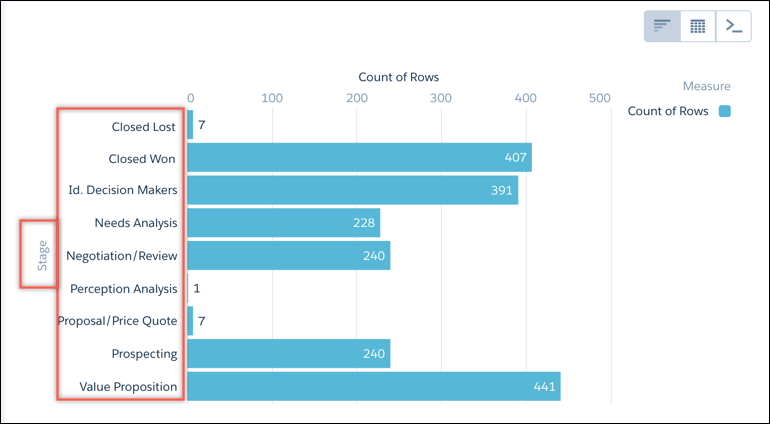
The following sample chart shows field names and values as they are stored in the dataset.
Custom display labels for dimension field values are specified in the members section of the XMD file within the section you are modifying (such as dimensions). If you have a large XMD file, you can do a text search to find the appropriate members section.
For example, the bold text in this XMD snippet shows how to change the labels for two
values of the StageName
field.
1"field":"StageName",
2         "members":[
3            {
4               "label":"Closed (Lost)",
5               "member":"Closed Lost"
6            },
7            {
8               "label":"Closed (Won)",
9               "member":"Closed Won"
10            }
11         ],
Here’s how the label customizations appear in the chart.