Visualforce Developer Guide
 j
jNewer Version Available
Integrating Visualforce and Google Charts
Google Charts provides a way to dynamically render data through different visualizations. Combined with Visualforce, the Google Charts can offer more flexibility and distribution potential than using a dashboard. Since the charts are generated through a URL, the visualizations can be shared and embedded wherever images are permitted.
There are two prerequisites before using the Google Charts API. The first is to determine how to encode the data. The Google Charts API has three data encoding types—text, simple, and extended. For this example, we'll only use the simple encoding. The second is to decide what type of chart to use. For this example, a user will choose between a bar graph or a line chart.
The custom controller has two important
functions—init() and create()—that correspond to
the requirements above:
- The function init() takes a numeric value and converts it to Google Chart's simple data encoding type. For more information, see Simple Encoding Data Format in the Google Charts API documentation.
- The function create() constructs the URL that makes the request to the Google Charts API.
The following code represents the
controller for the Visualforce page:
1/* This class contains the encoding algorithm for use with the
2 Google chartAPI. */
3
4public class GoogleDataEncoding {
5 // Exceptions to handle any erroneous data
6 public class EncodingException extends Exception {}
7 public class UnsupportedEncodingTypeException
8 extends Exception {}
9
10 /* The encoding map which takes an integer key and returns the
11 respective encoding value as defined by Google.
12 This map is initialized in init() */
13 private Map<Integer, String> encodingMap { get; set; }
14
15 /* The maximum encoding value supported for the given encoding
16 type. This value is set during init() */
17 private Integer encodingMax { get; set; }
18
19 /* The minimum encoding value supported for the given encoding
20 type. This value is set during init() */
21 private Integer encodingMin { get; set; }
22
23 /* The encoding type according to Google's API. Only SIMPLE
24 is implemented. */
25 public enum EncodingType { TEXT, SIMPLE, EXTENDED }
26
27 /* The minimum value to use in the generation of an encoding
28 value. */
29 public Integer min { get; private set; }
30
31 /* The maximum value to use in the generation of an encoding
32 value. */
33 public Integer max { get; private set; }
34
35 // The encoding type according to the API defined by Google
36 public EncodingType eType { get; private set; }
37
38 // Corresponds to the data set provided by the page
39 public String dataSet { get; set; }
40
41 // Corresponds to the type of graph selected on the page
42 public String graph { get; set; }
43
44 // The URL that renders the Google Chart
45 public String chartURL { get; set; }
46
47 // Indicates whether the chart should be displayed
48 public Boolean displayChart { get; set; }
49
50 public GoogleDataEncoding() {
51 min = 0;
52 max = 61;
53 eType = EncodingType.SIMPLE;
54 displayChart = false;
55 init();
56 }
57
58 public PageReference create() {
59 String[] dataSetList = dataSet.split(',', 0);
60 String mappedValue = 'chd=s:';
61
62 chartURL = 'http://chart.apis.google.com/chart?chs=600x300'
63 + '&chtt=Time+vs|Distance&chxt=x,y,x,y'
64 + '&chxr=0,0,10,1|1,0,65,5'
65 + '&chxl=2:|Seconds|3:|Meters';
66
67 if (graph.compareTo('barChart') == 0)
68 {
69 chartURL += '&cht=bvs';
70 }
71 else if (graph.compareTo('lineChart') == 0)
72 {
73 chartURL += '&cht=ls';
74 }
75 else
76 {
77 throw new EncodingException('An unsupported chart type'
78 + 'was selected: ' + graph + ' does not exist.');
79 }
80
81 for(String dataPoint : dataSetList)
82 {
83 mappedValue +=
84 getEncode(Integer.valueOf(dataPoint.trim()));
85 }
86
87 chartURL += '&' + mappedValue;
88 displayChart = true;
89 return null;
90 }
91
92
93 /* This method returns the encoding type parameter value that
94 matches the specified encoding type. */
95 public static String getEncodingDescriptor(EncodingType t) {
96 if(t == EncodingType.TEXT) return 't';
97 else if(t == EncodingType.SIMPLE) return 's';
98 else if(t == EncodingType.EXTENDED) return 'e';
99 else return '';
100 }
101
102 /* This method takes a given number within the declared
103 range of the encoding class and encodes it according to the
104 encoding type. If the value provided fall outside of the
105 declared range, an EncodingException is thrown. */
106 public String getEncode(Integer d) {
107 if(d > max || d < min) {
108 throw new EncodingException('Value provided ' + d
109 + ' was outside the declared min/max range ('
110 + min + '/' + max + ')');
111 }
112 else {
113 return encodingMap.get(d);
114 }
115 }
116
117 /* This method initializes the encoding map which is then
118 stored for expected repetitious use to minimize statement
119 invocation. */
120 private void init() {
121 if(eType == EncodingType.SIMPLE) {
122 encodingMax = 61;
123 encodingMin = 0;
124 encodingMap = new Map<Integer, String>();
125 encodingMap.put(0,'A');
126 encodingMap.put(1,'B');
127 encodingMap.put(2,'C');
128 encodingMap.put(3,'D');
129 encodingMap.put(4,'E');
130 encodingMap.put(5,'F');
131 encodingMap.put(6,'G');
132 encodingMap.put(7,'H');
133 encodingMap.put(8,'I');
134 encodingMap.put(9,'J');
135 encodingMap.put(10,'K');
136 encodingMap.put(11,'L');
137 encodingMap.put(12,'M');
138 encodingMap.put(13,'N');
139 encodingMap.put(14,'O');
140 encodingMap.put(15,'P');
141 encodingMap.put(16,'Q');
142 encodingMap.put(17,'R');
143 encodingMap.put(18,'S');
144 encodingMap.put(19,'T');
145 encodingMap.put(20,'U');
146 encodingMap.put(21,'V');
147 encodingMap.put(22,'W');
148 encodingMap.put(23,'X');
149 encodingMap.put(24,'Y');
150 encodingMap.put(25,'Z');
151 encodingMap.put(26,'a');
152 encodingMap.put(27,'b');
153 encodingMap.put(28,'c');
154 encodingMap.put(29,'d');
155 encodingMap.put(30,'e');
156 encodingMap.put(31,'f');
157 encodingMap.put(32,'g');
158 encodingMap.put(33,'h');
159 encodingMap.put(34,'i');
160 encodingMap.put(35,'j');
161 encodingMap.put(36,'k');
162 encodingMap.put(37,'l');
163 encodingMap.put(38,'m');
164 encodingMap.put(39,'n');
165 encodingMap.put(40,'o');
166 encodingMap.put(41,'p');
167 encodingMap.put(42,'q');
168 encodingMap.put(43,'r');
169 encodingMap.put(44,'s');
170 encodingMap.put(45,'t');
171 encodingMap.put(46,'u');
172 encodingMap.put(47,'v');
173 encodingMap.put(48,'w');
174 encodingMap.put(49,'x');
175 encodingMap.put(50,'y');
176 encodingMap.put(51,'z');
177 encodingMap.put(52,'0');
178 encodingMap.put(53,'1');
179 encodingMap.put(54,'2');
180 encodingMap.put(55,'3');
181 encodingMap.put(56,'4');
182 encodingMap.put(57,'5');
183 encodingMap.put(58,'6');
184 encodingMap.put(59,'7');
185 encodingMap.put(60,'8');
186 encodingMap.put(61,'9');
187 }
188 }
189}
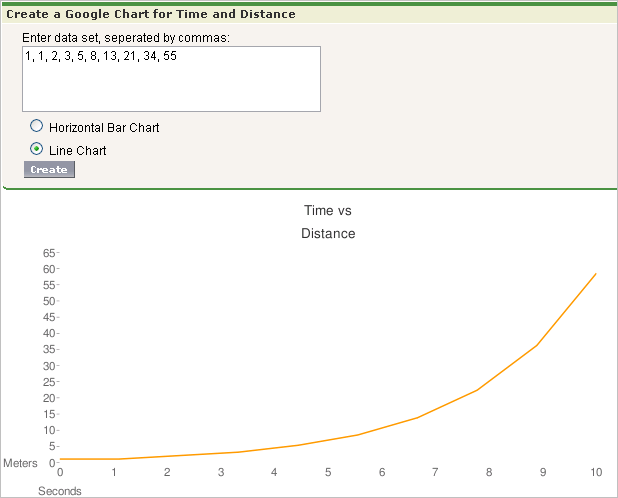
The Visualforce page needs two input elements: one for the chart type, and one for
the data set. Below is a sample page that constructs the form to collect
this information:
1<apex:page controller="GoogleDataEncoding">
2    <apex:form >
3        <apex:pageBlock
4               title="Create a Google Chart for Time and Distance">
5            <apex:outputLabel
6               value="Enter data set, separated by commas: "
7               for="dataInput"/><br/>
8            <apex:inputTextArea
9               id="dataInput" title="First Data Point"
10               value="{!dataSet}" rows="3" cols="50"/><br/>
11            <apex:selectRadio value="{!graph}"
12               layout="pageDirection">
13                <apex:selectOption itemValue="barChart"
14               itemLabel="Horizontal Bar Chart"/>
15                <apex:selectOption itemValue="lineChart"
16               itemLabel="Line Chart"/>
17            </apex:selectRadio>
18            <apex:commandButton action="{!create}"
19               value="Create"/>
20        </apex:pageBlock>
21    </apex:form>
22    <apex:image url="{!chartURL}" alt="Sample chart"
23               rendered="{!displayChart}"/>
24</apex:page>