


Apex Developer Guide
 j
jDecode the Fact Map
Depending on how you run a report, the fact map in the report results can contain values for only summary or both summary and detailed data. The fact map values are expressed as keys, which you can programmatically use to visualize the report data. Fact map keys provide an index into each section of a fact map, from which you can access summary and detailed data.
The pattern for the fact map keys varies by report format as shown in this table.
| Report format | Fact map key pattern |
|---|---|
| Tabular |
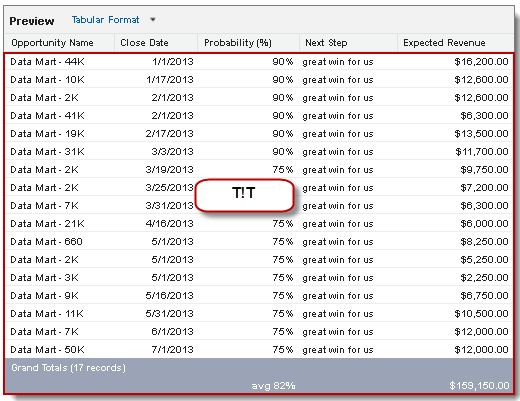
T!T: The grand total of a report. Both record data values and the grand total are represented by this key. |
| Summary |
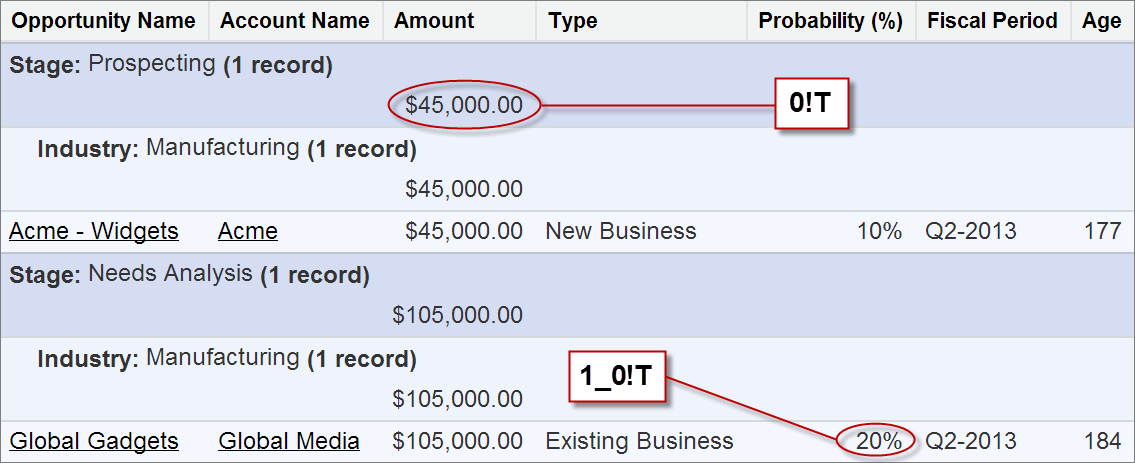
<First level row grouping_second level row grouping_third level row grouping>!T: T refers to the row grand total. |
| Matrix |
<First level row grouping_second level row grouping>!<First level column grouping_second level column grouping>. |
Each item in a row or column grouping is numbered starting with 0. Here are some examples of fact map keys:
| Fact Map Key | Description |
|---|---|
| 0!T | The first item in the first-level grouping. |
| 1!T | The second item in the first-level grouping. |
| 0_0!T | The first item in the first-level grouping and the first item in the second-level grouping. |
| 0_1!T | The first item in the first-level grouping and the second item in the second-level grouping. |
Let’s look at examples of how fact map keys represent data as it appears in a Salesforce tabular, summary, or matrix report.
Matrix Report Fact Map
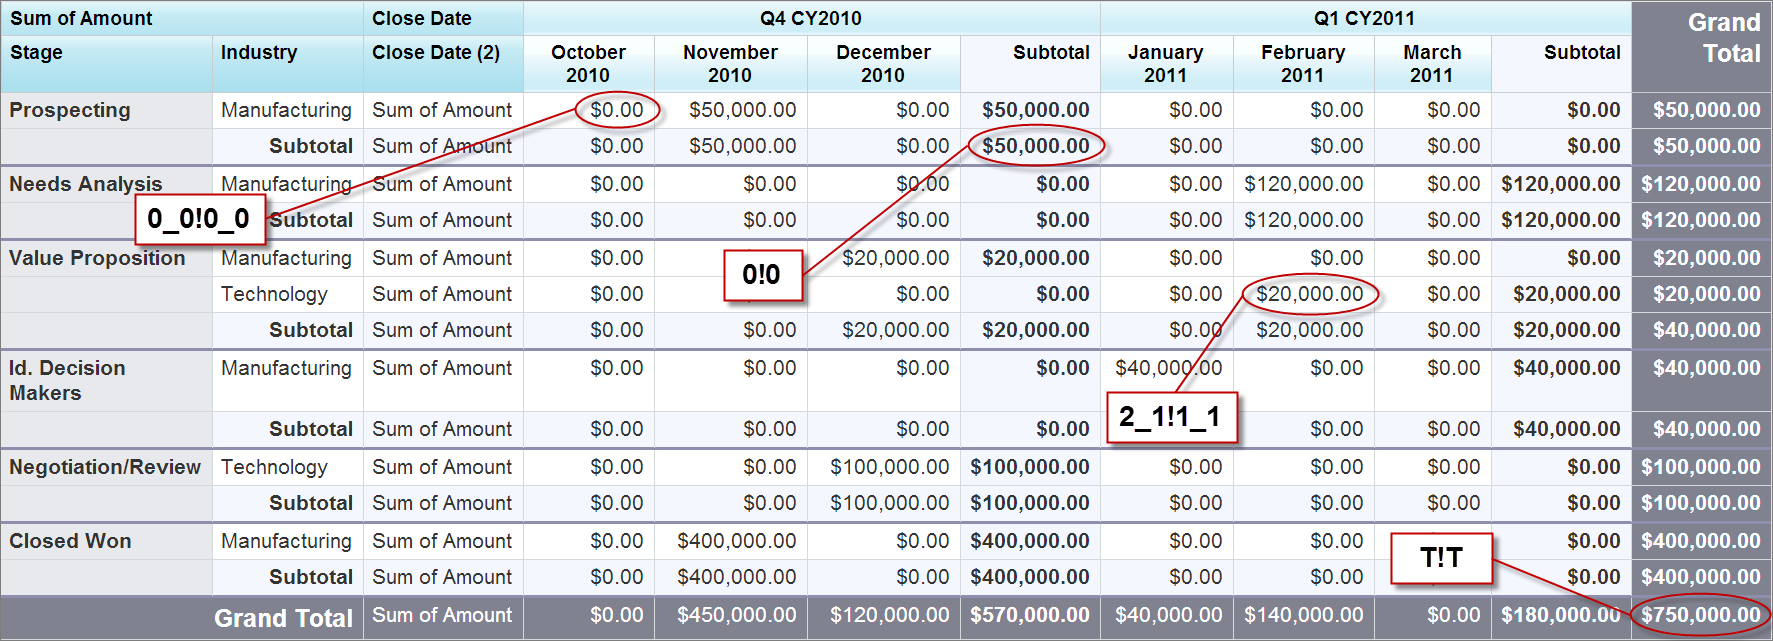
Here’s an example of some fact map keys for data in a matrix opportunities report with a couple of row and column groupings.
| Fact Map Key | Description |
|---|---|
| 0!0 | Total opportunity amount in the Prospecting stage in Q4 2010. |
| 0_0!0_0 | Total opportunity amount in the Prospecting stage in the Manufacturing sector in October 2010. |
| 2_1!1_1 | Total value of opportunities in the Value Proposition stage in the Technology sector in February 2011. |
| T!T | Grand total summary for the report. |