Wave Analytics ダッシュボード JSON ガイド
 j
j積み上げ滝グラフの例
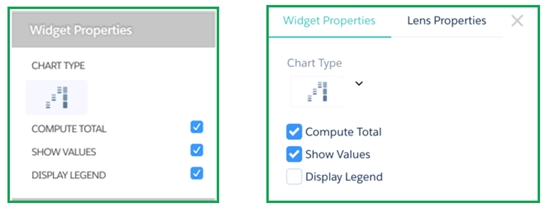
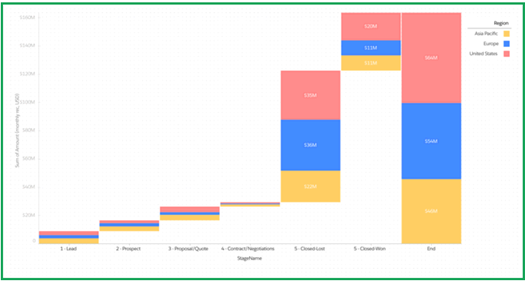
stackwaterfall chartType のグラフウィジェットの JSON の例を示します。
サンプル JSON
1"ng2":
2{
3	"type": "Chart",
4	"position": {
5		"x": 450,
6		"y": 0,
7		"w": 440,
8		"h": 320
9	},
10	"parameters": {
11		"step": "step_two_dims",
12		"chartType": "stackwaterfall",
13		“computeTotal”: false,
14                “showValues”: false,
15                “legend”: true
16	}
17}
グラフウィジェット