Use the VS Code Extension to Analyze Your Code
The Salesforce Code Analyzer Visual Studio Code (VS Code) extension integrates many of Code Analyzer’s most useful features into VS Code, so you can run them easily with clicks instead of terminal CLI commands.
The Code Analyzer VS Code extension is available for installation in the VS Code desktop application. It comes pre-installed in Code Builder as a part of the Salesforce Extensions for VS Code Expanded pack.
You can use the Code Analyzer VS Code Extension in the VS Code desktop application on your local computer or in Code Builder.
Before you begin, be sure these minimum system requirements are installed on your computer.
- VS Code: Version 1.90.0 or higher.
- Java: Version 11 or higher. (Required for the PMD, CPD, and Salesforce Graph engines.)
- Python: Version 3.10 or higher. (Required for the Flow Scanner engine.)
Then follow these steps to update your VS Code desktop application with the Code Analyzer extension and its dependencies.
-
Install Salesforce CLI on your computer.
-
Install the required Salesforce Code Analyzer CLI plugin by running this command in the VS Code terminal:
-
Install the Salesforce Extensions for VS Code (Expanded) extension pack.
The expanded extension pack installs tools for developing on Salesforce Platform, including the Code Analyzer VS Code extension.
You can also install the Code Analyzer VS Code extension on its own if you prefer not to install the full Salesforce expanded pack.
-
Optionally customize your Code Analyzer configuration by creating a YAML configuration file and putting it in your project root. You can also specify the location of the configuration file with a VS Code setting:
- Open VS Code and go to the Settings tab (Code > Settings > Settings) and search for
Code Analyzer. - Click the User tab to change the setting globally or click Workspace to change it for just your workspace.
- Add the path to a configuration file to the Code Analyzer: Config File setting. The default Code Analyzer configuration is designed to meet the needs of most users, which is why this step is optional. See Customize the Configuration for details.
- Open VS Code and go to the Settings tab (Code > Settings > Settings) and search for
Before you begin, be sure you set up Code Builder. Code Builder comes with almost everything you need, such as VS Code, Salesforce extensions (including the Code Analyzer VS Code extension), Salesforce CLI, Java, and Python. Then follow these steps to finish the install and configuration.
-
Install the required Salesforce Code Analyzer CLI plugin by running this command in the Code Builder terminal:
-
Optionally customize your Code Analyzer configuration by creating a YAML configuration file and putting it in your project root. You can also specify the location of the configuration file with a VS Code setting:
- Open VS Code and go to the Settings tab (Code > Settings > Settings) and search for
Code Analyzer. - Click the User tab to change the setting globally or click Workspace to change it for just your workspace.
- Add the path to a configuration file to the Code Analyzer: Config File setting. The default Code Analyzer configuration is designed to meet the needs of most users, which is why this step is optional. See Customize the Configuration for details.
- Open VS Code and go to the Settings tab (Code > Settings > Settings) and search for
The rest of this documentation uses the term VS Code to refer to both the desktop application and Code Builder.
Follow these general steps to scan your code; see subsections for details about specific steps.
- Open your project in VS Code.
- Scan your code with Code Analyzer.
- Update your code based on the findings.
- Rescan your code to ensure you addressed all the issues; iterate as needed.
- If you’re listing a managed package on AppExchange, see Produce Code Analyzer Reports for AppExchange Security Review.
To perform a Code Analyzer scan of selected files or folders, complete these steps.
To scan selected files or folders:
- Select a group of files or folders in the VS Code Explorer.
- Right-click the files or folders and select SFDX: Scan Selected Files or Folders with Code Analyzer.
To scan a single code file:
- Open a code file in the VS Code editor.
- From the VS Code Command Palette, select SFDX: Scan Current File with Code Analyzer.
- Alternatively, right-click in the VS Code editor and select SFDX: Scan Current File with Code Analyzer.
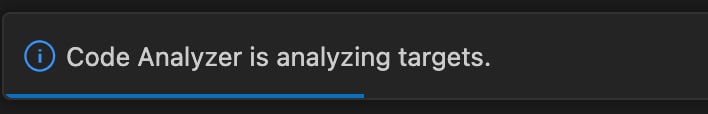
The progress bar notifies you that the scan of your current file is active.
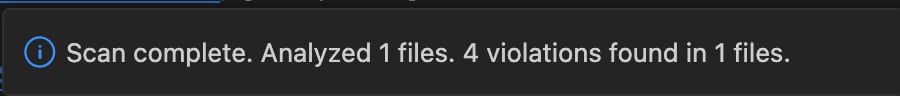
After your scan is complete, note how many files were scanned and how many violations were produced.
When your scan is complete, click the scan summary in the progress bar (1). You see a scrollable list of violations in the Problems tab that Code Analyzer found (2).
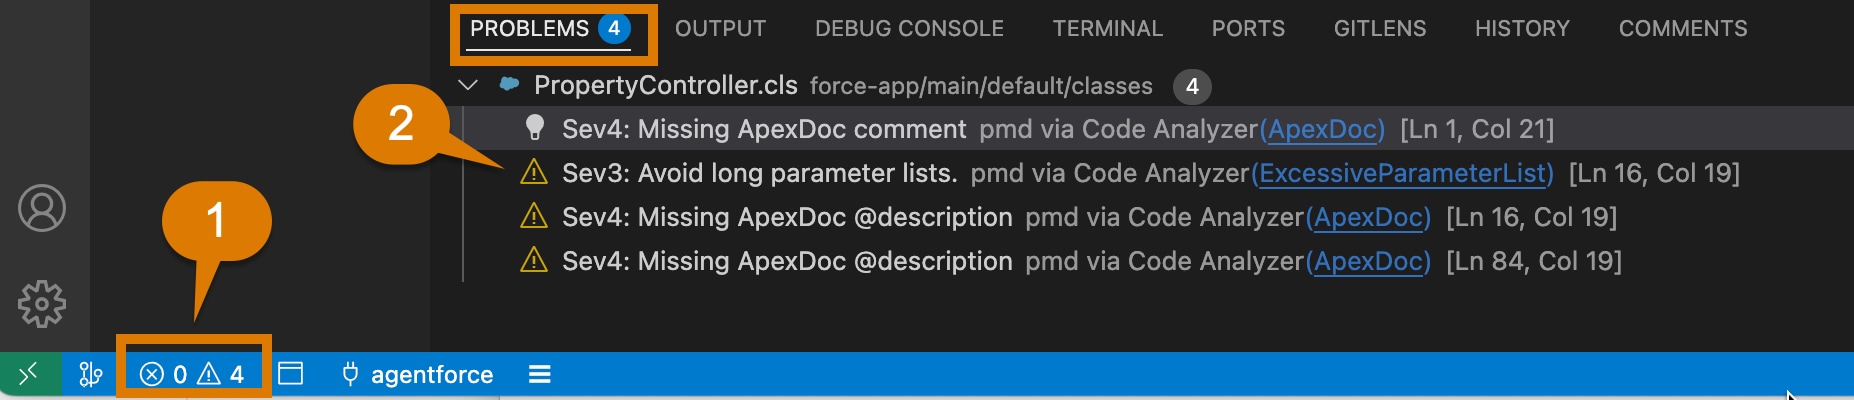
Each violation message indicates the violation severity and details about the violation found, using this pattern: SevX: [Violation message]. For example:
Sev3. Validate CRUD permission before SOQL/DML operation or enforce user mode. (PMD via Code Analyzer)
To address the violations found and rescan your code:
- Scroll through the results that Code Analyzer found.
- Update and save your code directly in VS Code.
- When your edits are complete, rescan your code, using your preferred method.
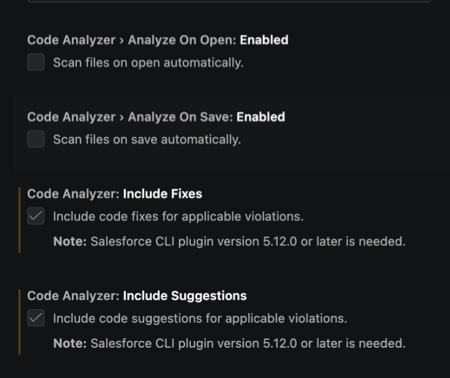
Use Code Analyzer guidance in the VS Code extension to review and address ESLint violations directly in the editor. For applicable violations, you can review fixes in an interactive prompt and accept or reject the proposed changes. Fixes and suggestions aren’t available for every violation. The engine provides code suggestions, but unlike code fixes, suggestions don’t include an automatic fix.
In VS Code, go to Settings > Settings.
-
Search for Code Analyzer. Enable Include code fixes for applicable violations and Include code suggestions for applicable violations.
-
Open the code file that you want to scan.
-
Open the Command Palette, and select SFDX: Scan Current File with Code Analyzer.
-
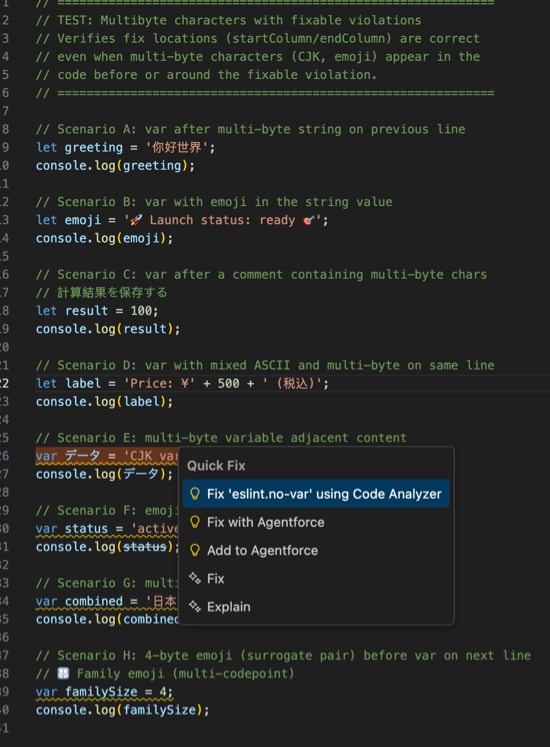
Hover over a reported violation to view its details.
-
Select the option to fix the violation with Code Analyzer.
-
Review the highlighted changes, and accept or reject them.
Using Code Analyzer to identify problems and violations in your code is fantastic, but you can also use Agentforce Vibes to fix them too.
Agentforce Vibes Extension is a VS Code extension designed to assist with code generation, code completion, and other coding tasks, making the Salesforce development process much smoother. Code Analyzer seamlessly integrates with Agentforce Vibes extension by offering suggested code fixes for a set of PMD violations. You can then choose to accept or reject the code fixes.
-
If you installed the Code Analyzer VS Code extension on its own, rather than as part of the Salesforce expanded extension pack, install the Agentforce Vibes Extension. The Salesforce expanded extension pack includes the Agentforce Vibes extension.
-
Open the VS Code Settings tab (Code > Settings > Settings) and ensure that the Editor: Code Lens setting is enabled.
-
Scan your code as usual.
-
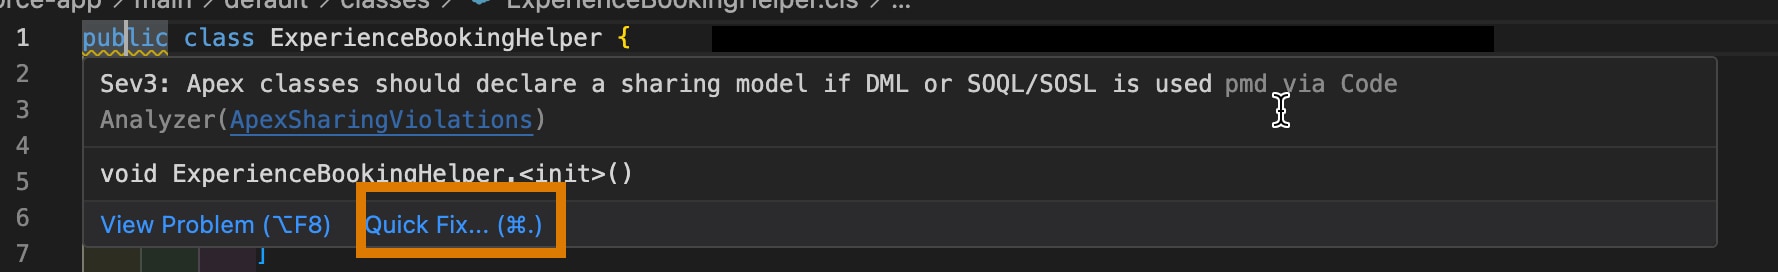
Hover over the identified PMD violation until a small window opens that displays the violation.
-
Click Quick Fix.
-
Click Fix <violation> using Code Analyzer, where <violation> is one of the PMD violations that can be fixed with Code Analyzer.
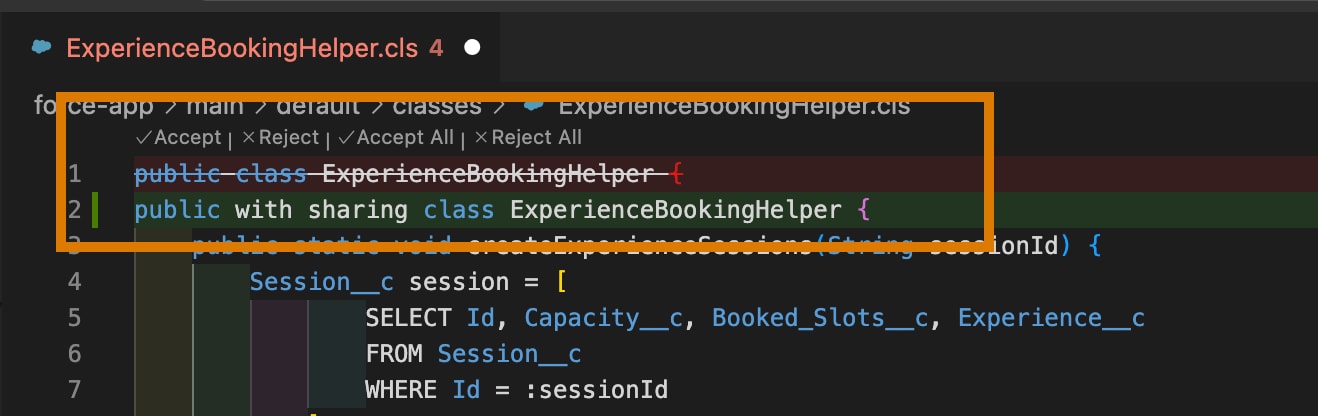
The original code that had the problem is crossed out and the new suggested code is shown below it, along with buttons to accept or reject the suggestions.
-
Click to accept or reject the highlighted suggested deletions and additions.
Examples of PMD violations that you can fix with Agentforce Vibes include some of those in the ErrorProne, Security, Best Practices, Code Style, Design, and Documentation PMD Apex rules categories. Here’s the exact list of rule names.
By default, Code Analyzer selects the recommended rules for all available engines when it runs a scan. But you can use a VS Code setting to specify a customized set of rules that you want to run based on engine name, severity level, rule name, or tags.
-
Open the VS Code Settings tab (Code > Settings > Settings) and search for Code Analyzer: Rule Selectors setting.
-
Click the User tab to change the setting globally or click Workspace to change it for just your workspace.
-
Add your rule selectors to the text box. The default value is
Recommended.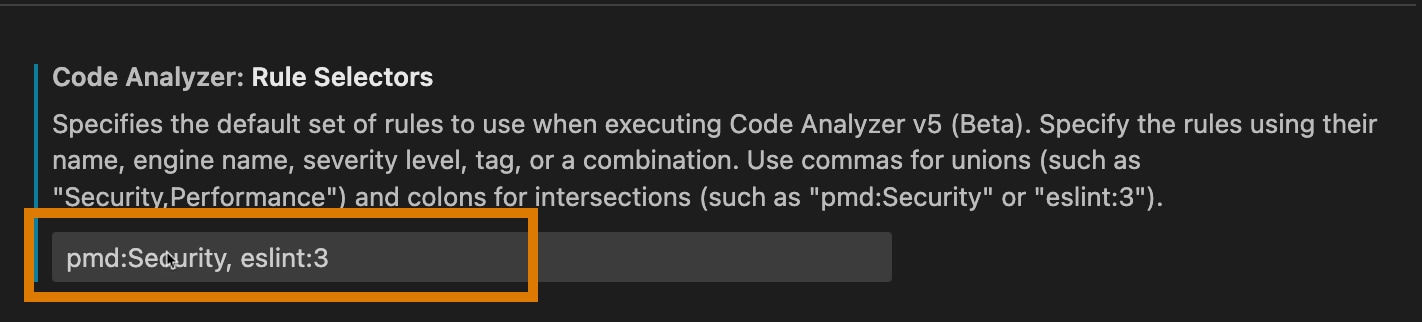
Here are some other sample values:
Recommended:Security,Recommended:Performance: Selects the recommended security and performance rules for all engines.pmd:Security: Selects only the security rules for the PMD engine.eslint:Recommended:ErrorProne:2: Selects the recommended ESLint rules that also have the tagErrorProneand a high severity level (2).
This setting is the VS Code equivalent of the
--rule-selectorCLI command flag; for more information and examples, see Use CLI Commands to Analyze Your Code. -
From the Command Palette, run Developer: Reload Window.
By default, Code Analyzer displays all violations as warnings in the VS Code editor. You can customize how violations of different severities (1 through 5) appear in the editor to suit your team’s workflow.
For example, you can configure critical Severity 1 and Severity 2 violations to appear as Errors (red squiggles) that demand immediate attention. Then set lower priority violations (Severity 4 or 5) to Info (subtle blue indicators).
To map Code Analyzer severities to VS Code diagnostic levels:
-
Open Settings and search for Code Analyzer Severity.
-
Locate the five settings corresponding to the severity levels:
- Code Analyzer: Severity 1
- Code Analyzer: Severity 2
- Code Analyzer: Severity 3
- Code Analyzer: Severity 4
- Code Analyzer: Severity 5
-
Click the User tab to change the setting globally or click Workspace to change it for only your current project.
-
For each severity level, select a diagnostic display option from the dropdown menu:
- Error: Displays as a red squiggle. (Recommended for critical issues)
- Warning: Displays as a yellow squiggle. (Default)
- Info: Displays as a blue underline/indicator.
Note: If you don’t change these settings, all violations continue to appear as warning.
After you scan your code with Code Analyzer, there can be situations where you want to suppress a PMD violation that was identified. You can suppress violations on a line of code or the entire class.
To use a quick fix to suppress a PMD violation, complete these steps.
- Hover over the identified problem.
- In the window that opens, click Quick Fix.
- Click Suppress all PMD violations on this line or Suppress <RuleName> on this class as needed, where
<RuleName>refers to the name of the rule associated with the violation, such asApexDoc.
After you’ve run a scan, you sometimes want to clear the violations that appear in your file and start again.
- In the VS Code editor while viewing the file, right-click and select SFDX: Clear Code Analyzer Violations from Current File.
- To clear violations in multiple files or folders, select them from the Explorer view, right-click and select SFDX: Clear Code Analyzer Violations from Selected Files or Folders.
Use VS Code settings to configure Code Analyzer to automatically scan your code when you open or save a file.
-
Open the VS Code Settings tab (Code > Settings > Settings) and search for
Code Analyzer. -
Click the User tab to change the setting globally or click Workspace to change it for just your workspace.
-
Click Code Analyzer: Analyze on Open and Code Analyzer:Analyze on Save as needed.
The text box associated with each setting initially contains the comma-separated list of default extensions for Salesforce files (
.cls,.js,.apex,.trigger,.ts,.xml). If you want Code Analyzer to scan other types of files, update the list with their extensions, such as.txt,.html. -
From the Command Palette, run Developer: Reload Window.
ApexGuru is a Salesforce feature that uses AI and machine learning to detect and help you fix performance-related problems in your Apex code. ApexGuru’s automated code optimization features are directly integrated into the Code Analyzer VS Code extension.
Unlike other Code Analyzer features, the ApexGuru integration requires that you authorize a Salesforce org in which ApexGuru has been activated.
To analyze your code with ApexGuru, complete these steps.
-
Ensure that your org supports ApexGuru and that it’s activated. See ApexGuru Insights.
-
In VS Code, authorize your org:
-
From the command palette, run the SFDX: Authorize an Org command.
-
Select the way you log in to org.
For example, if you log in to your org using the default URL in your DX project file (usually
https://login.salesforce.com), then select Project Default. If your org is a sandbox, then select Sandbox. -
Enter an alias for your org, such as
apexguru. -
In the browser that opens, log in to your org using your Salesforce credentials.
-
When you get the Authentication Successful message in the browser, your org was successfully authorized for VS Code and you can close the browser window.
-
-
In VS Code, right-click an Apex
.clsfile and select the SFDX: Scan Selected File for Performance Issues With ApexGuru command.You can scan only one file at a time with ApexGuru, so the command doesn’t show up when you right-click a folder. If you select multiple files and then right-click, only the first file is scanned.
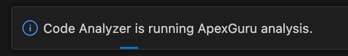
The progress bar shows the ApexGuru scan running, and then displays how many violations it found.
If you don’t see the SFDX: Scan Selected File for Performance Issues With ApexGuru command, then your org doesn’t support ApexGuru, it isn’t activated in your org, or you didn’t authorize the org correctly. See the previous two steps.
-
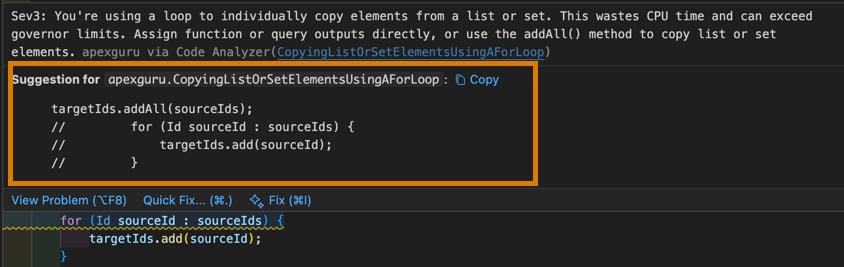
If any ApexGuru violations are discovered, they appear underlined in the document and in the
PROBLEMStab. Hover over the identified violation until a small window opens that displays more information about the violation. The window includes an explanation of the violation, and may also contain suggested code that you can copy and paste into your Apex.clsfile to resolve the violation.