Use the VS Code Extension to Analyze Your Code (Retired)
The Salesforce Code Analyzer Visual Studio (VS) Code Extension integrates many of Code Analyzer’s most useful features into VS Code, so you can run them easily with clicks instead of with terminal commands.
Use Code Analyzer to scan your code using these static analyzers, also known as rule engines:
- PMD rule engine. The VS Code extension also supports the
pmd-appexchangecustom PMD variant, although it’s not enabled by default. Enable it with a setting. - RetireJS
- ESLint
- Salesforce Graph Engine (Generally Available rules only)
The Salesforce Code Analyzer VS Code Extension is included in the Salesforce for VS Code expanded pack. The Code Analyzer VS Code extension also relies on Salesforce CLI. To ensure that all these moving parts work together, make sure you adhere to these minimum system requirements:
- Visual Studio Code: Version 1.82.0 or later.
- Java Platform, Standard Edition Development Kit (JDK): Versions 11, 17, or 21.
- Salesforce CLI: Version 2.0.2 or later.
-
Install Salesforce CLI.
-
Install the Salesforce Extensions for Visual Studio Code (Expanded) extension pack.
This extension pack installs tools for developing on Salesforce Platform, including the Code Analyzer VS Code extension. The extension also installs the required Salesforce Code Analyzer CLI plugin (
@salesforce/sfdx-scanner) using this CLI command: -
(Optional) Specify the engines you want to use in your code scans. VS Code is configured to run a default set of engines, but you can specify more. To learn how to specify the engines, and other settings, see Use Settings to Customize How Code Analyzer Works.
You can also install the Code Analyzer VS Code extension on its own if you prefer not to install the full Salesforce expanded pack.
Follow these general steps to scan your code; see subsections for details about specific steps.
- Open your project in VS Code.
- Scan your code with Code Analyzer using the RetireJS, PMD, and ESLint engines.
- Update your code based on the findings.
- Rescan your code to ensure you addressed all the issues; iterate as needed.
- Scan individual methods within your code with Code Analyzer Graph Engine path-based analysis.
- Update your code based on the findings.
- Rescan your code with Graph Engine as needed.
- If you’re listing a managed package on AppExchange, see Produce Code Analyzer Reports for AppExchange Security Review.
To perform a Code Analyzer scan of selected files or folders, complete these steps.
-
To scan selected files or folders:
- Select a group of files or folders.
- Right-click in the VS Code Explorer and then select SFDX: Scan Selected Files or Folders with Code Analyzer.
-
To perform a Code Analyzer scan of a single code file:
- Open a code file in the VS Code editor.
- From the VS Code Command Palette, select SFDX: Scan Current File with Code Analyzer.
- Alternatively, right-click in the VS Code editor and select SFDX: Scan Current File with Code Analyzer.
The progress bar notifies you that the scan of your current file is active.
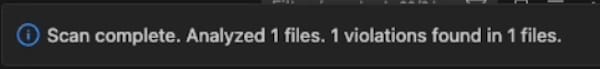
After your scan is complete, note how many files were scanned and how many violations were produced.
When your scan is complete, click the scan summary in the progress bar (1). You see a scrollable list of violations that Code Analyzer found (2).
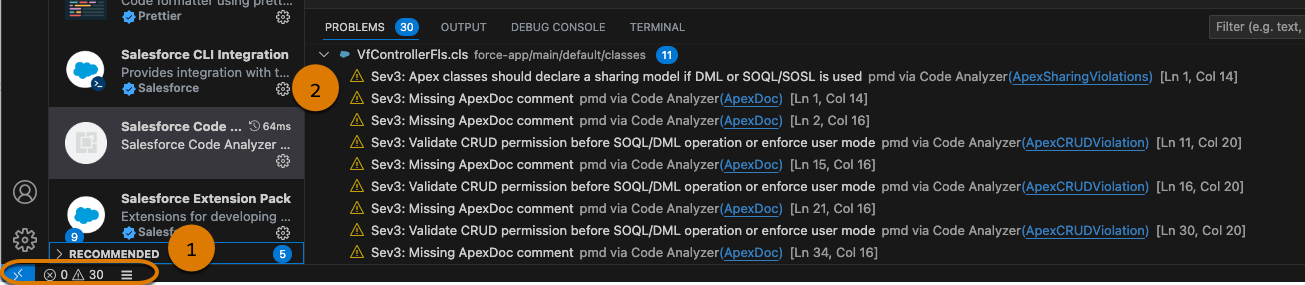
Each violation message indicates the violation severity and details about the violation found, using this pattern: SevX: [Violation message]. For example:
Sev3. Validate CRUD permission before SOQL/DML operation or enforce user mode. (PMD via Code Analyzer)
To address the violations found and rescan your code:
- Scroll through the results that Code Analyzer found.
- Update your code directly in VS Code.
- When your edits are complete, rescan your code, using your preferred method.
You can perform a Graph Engine path-based analysis on a single method or a full project.
-
To scan a method:
- Open a file in the VS Code Editor.
- Right-click on the method that you want to scan.
- Select SFDX: Scan Selected Method with Graph Engine Path-Based Analysis.
-
To scan your project:
- Open your project in the VS Code Editor.
- From the VS Code Command Palette, select SFDX: Scan Project with Graph Engine Path-Based Analysis.
The progress bar notifies you that the scan of your current file is active.

When your scan is complete, a new tab opens with an HTML display of the violations found.
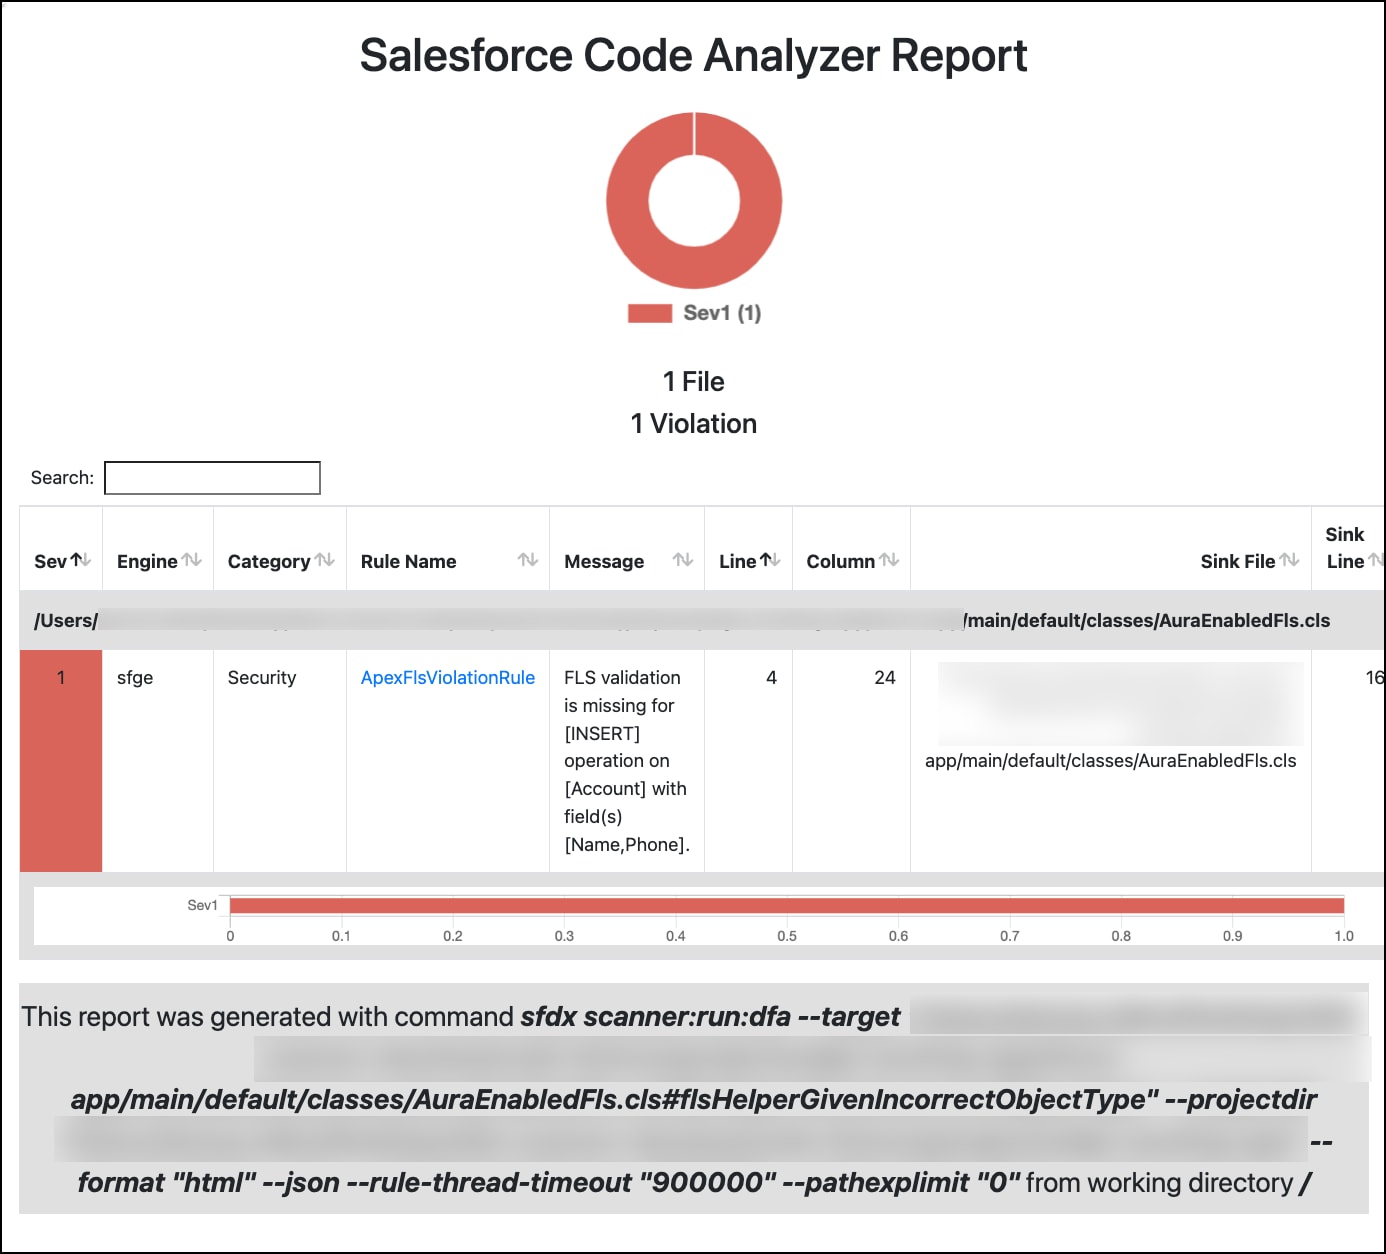
Each violation message reveals the violation severity and details about the violation.
Examples:
To address the violations found and to rescan your code, complete these steps.
- On the VS Code tab with your Graph Engine results, review the violations that Graph Engine found.
- On the VS Code tab with your code file open, update your code.
- When your edits are complete, rescan your code.
Here are a few tips that can help you as you scan your code.
After you scan your code with Code Analyzer, there can be situations where you want to suppress a PMD violation that was identified. You can suppress violations on a line of code or the entire class.
To use a quick fix to suppress a PMD violation, complete these steps.
- Hover over the identified problem.
- In the window that opens, click Quick Fix.
- Click Suppress violations on this line or Suppress violations on this class as needed.
After you’ve run a scan, you sometimes want to clear the violations that appear in your file and start again. No problem! Simply right-click in the VS Code editor while viewing the file and select SFDX: Clear Code Analyzer violations from current file. You can also select the command from the Explorer view and clear violations in multiple selected files or a folder.
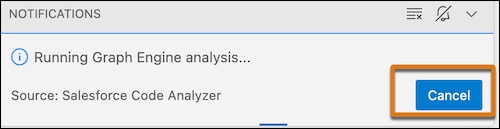
Depending on the size of your Apex class or your project, a Graph Engine analysis can take a long time. To cancel a running Salesforce Graph Engine analysis without waiting for it to finish, complete these steps:
-
Click the Running Graph Engine analysis message in the VS Code progress bar:
-
Click Cancel in the notification that pops up.
Full Salesforce Graph Engine analyses of your project can take a while to complete. After you run a full scan and fix some violations in a few files, it’s often quicker to then run a partial scan on just the code that you changed.
- Enable the Code Analyzer > Partial Salesforce Graph Engine Scans setting. See Use Settings to Customize How Code Analyzer Works.
- Scan your project using a full Graph Engine analysis.
- After you address any violations, rescan your project, and then chose whether you want to run a partial or full scan. The partial scan analyzes only the files you changed since the previous scan; the full scan analyzes all the files in your project.
If a partial scan completes with no violations, remember that you might still have violations in the code that you didn’t change since the previous scan. If necessary, rescan the project and opt to run a full scan again to get the complete list of violations.
As with most VS Code extensions, you can customize how Code Analyzer works by updating the associated settings. Examples of these settings include:
- Specify the engines you want to use in your code scans.
- Configure Code Analyzer to automatically scan your code when you open or save a file.
- Replace the default PMD configuration file with your own custom file; be sure you specify the absolute path to the file.
- Suppress warning violations in the Salesforce Graph Engine.
- Specify the category of rules to run.
- Normalize the severity across all engines.
The names of Code Analyzer settings all start with Code Analyzer >. Here’s how to find them:
- Open the VS Code Settings tab (Code > Settings > Settings).
- Enter
Code Analyzerin the search box, and then click Salesforce Code Analyzer under Extensions. - To specify engines for the current project, click the Workspace tab, or click User for all projects.
- Update the settings as needed. The setting descriptions provide the default and possible values when appropriate.
- From the Command Palette, run Developer: Reload Window.
If you’re an AppExchange partner and plan to list a managed package on AppExchange, the package must undergo and pass security review. Part of the security review process is scanning your code with Code Analyzer and uploading the scan reports.
First run Code Analyzer using the VS Code extension and update your code as needed. Then, to produce the required scan reports for your AppExchange listing, you must run Code Analyzer using the CLI commands, either using VS Code’s integrated terminal or in a standalone terminal or command window. Attach your scan reports to your submission in the AppExchange Security Review Wizard. See Scan Your Solution with Salesforce Code Analyzer for details.
ApexGuru uses AI and machine learning to detect and help you fix performance-related problems in your code. ApexGuru’s automated code optimization features are directly integrated into the Code Analyzer VS Code extension. See ApexGuru Insights.
The ApexGuru integration with the Code Analyzer VS Code extension is a pilot service that is subject to the Beta Services Terms at Agreements - Salesforce.com or a written Unified Pilot Agreement if executed by Customer, and applicable terms in the Product Terms Directory. Use of this pilot service is at the Customer’s sole discretion.
The feature is available to customers that have Scale Center enabled in their production environments. If you want to nominate yourself to participate in this pilot, follow this link.