
Starting April 14, 2026, we’re opening the beta for Web Console, a modern, browser-based IDE embedded directly into Salesforce workflows. It is designed to help developers work faster inside the platform they already know, without switching tools just to inspect code, run queries, debug an issue, or make a quick fix. The beta release is focused on helping developers investigate issues, make targeted changes, and validate those changes in one connected experience.
At its core, Web Console is built around a simple idea: developers should not have to leave Salesforce to build Salesforce apps. Web Console brings the IDE into the flow of work, so you can launch from Salesforce surfaces, stay in context, and move from investigation to fix with less setup and fewer interruptions. That idea comes down to one phrase: code where you build.
What is Web Console?
As a browser-based IDE that lives directly inside Salesforce, Web Console is designed to launch from the places where developers are already working, such as Setup and other context-rich entry points. As a result, you can inspect, debug, edit, and validate without breaking your flow. Rather than opening a separate tool and manually finding the right file or log, you can start from the issue itself and work forward from there.
This is more than a new editor in a browser tab. It is a different way of working. Web Console brings together modern editing with the features and capabilities developers need in the moment, including debug logs, SOQL execution, Query Plan Inspector, Anonymous Apex, quick Apex edits, and org-aware navigation. The result is a more direct path from “something broke” to “I found it, fixed it, and validated it.”
Why Web Console feels different in practice
The value of Web Console is not just feature access. It is usability in context.
When something fails in production or a sandbox, developers are usually not starting with a neat project plan. They are responding to an event, an error, or an unexpected behavior. Legacy diagnostic tools were built for this kind of reactive investigation because they keep runtime information close at hand and minimize setup. By contrast, more project-oriented IDE workflows can be powerful for sustained development, but they often introduce more state, more panes, and more cognitive overhead for short investigative tasks.
Web Console is designed to bridge that gap. It keeps the investigation close to where the issue surfaced, while giving developers a more modern, browser-based editing and debugging experience. That means less hunting across windows, less context switching between tools, and a faster path to understanding what happened and what to do next.
That is a big part of why this beta matters. It is not about replacing a legacy tool feature-by-feature. It is about making common developer workflows inside Salesforce faster, clearer, and more connected to the work already happening in the org.
What’s in the beta: debug logs, Anonymous Apex, SOQL, and quick edits
The beta is intentionally focused on the workflows developers and admins use most when they need to investigate and fix something quickly. These include debug log viewing, SOQL execution, Query Plan inspection, Anonymous Apex execution, and quick, in-context Apex edits. Web Console is also designed to support metadata navigation through an org-aware browser experience, so developers can stay grounded in the org while they work.
For example, in the beta you can:
- inspect runtime behavior with a dedicated logs experience,
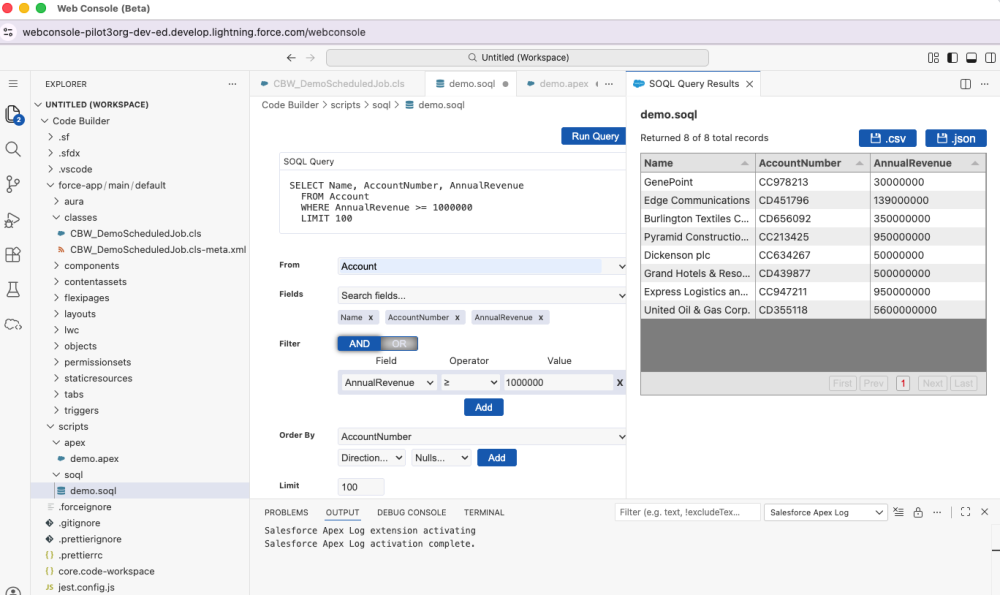
- execute SOQL and understand query performance with Query Plan Inspector,
- run Anonymous Apex without leaving the browser,
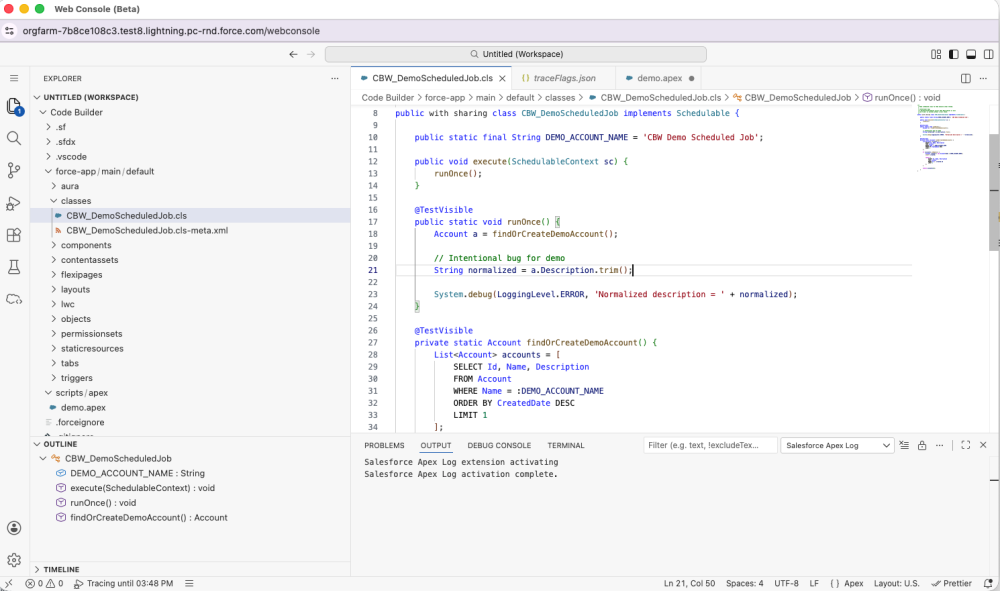
- open Apex from relevant Salesforce surfaces and make focused edits in context,
- navigate metadata without switching out to a separate development environment.
This is not a list of random features. It is a cohesive set of capabilities designed for the high-value moments where developers tend to lose time today: understanding a failure, tracing it to source, checking query behavior, making a targeted fix, and validating the outcome.
Connected workflow example: Debugging an Apex job failure
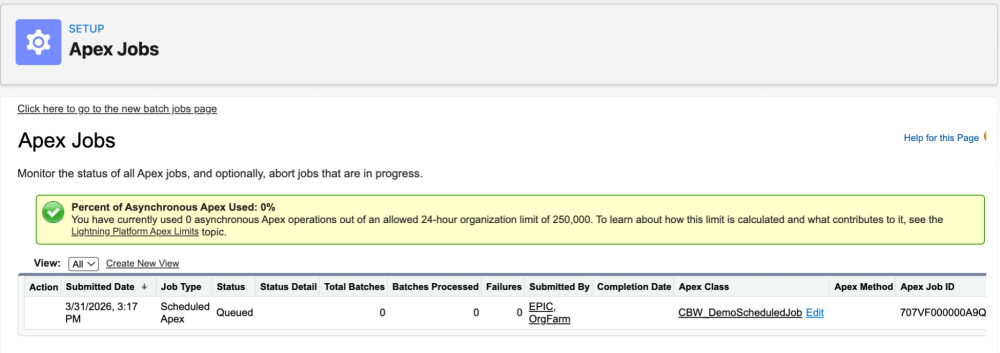
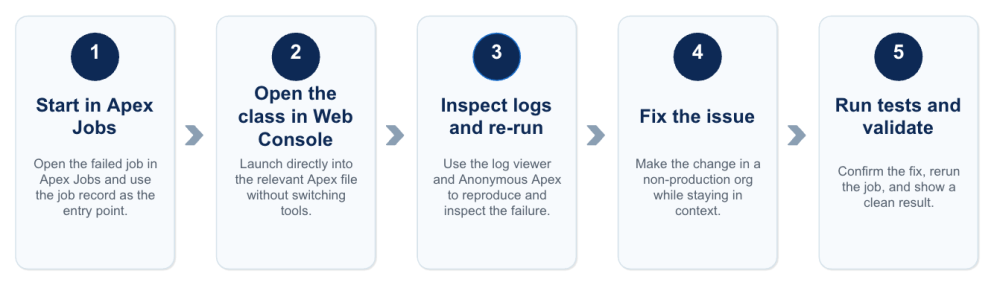
Apex job failures are a good example of where Web Console can make an immediate difference. A developer can begin in the Apex Jobs page, where a failed or long-running Apex job is already visible. From there, they can open the related Apex class in Web Console, enable logging, re-run the scenario, inspect the execution path, jump from the stack trace to the problematic line of code, make the fix, run tests, and validate that the job now completes successfully. They can do all of that without leaving Salesforce or bouncing between disconnected tools.
This streamlined flow is more efficient because it mirrors how real troubleshooting actually happens. The work does not begin in a file tree. It begins with a problem. Web Console is designed so the IDE meets the developer at that point of failure, then stays with them through diagnosis, code change, and validation.
This is one of the clearest ways Web Console improves usability. Instead of forcing the developer to reconstruct the situation across separate tools, it keeps runtime evidence, source code, and validation steps close together, shortening the distance between “What just happened?” and “Did my fix resolve the issue?”
Production versus non-production: Web Console guardrails
Web Console is built with the realities of Salesforce development in mind. In production orgs, Apex editing is read-only, letting developers inspect and understand code safely without any risk to live orgs. In sandboxes and other non-production environments, developers can make inline edits and save changes as part of a faster path-to-fix workflow.
That balance is important. A modern experience should make developers faster, but not by weakening platform guardrails. Web Console keeps the guardrails intact while still streamlining inspection, debugging, and validation.
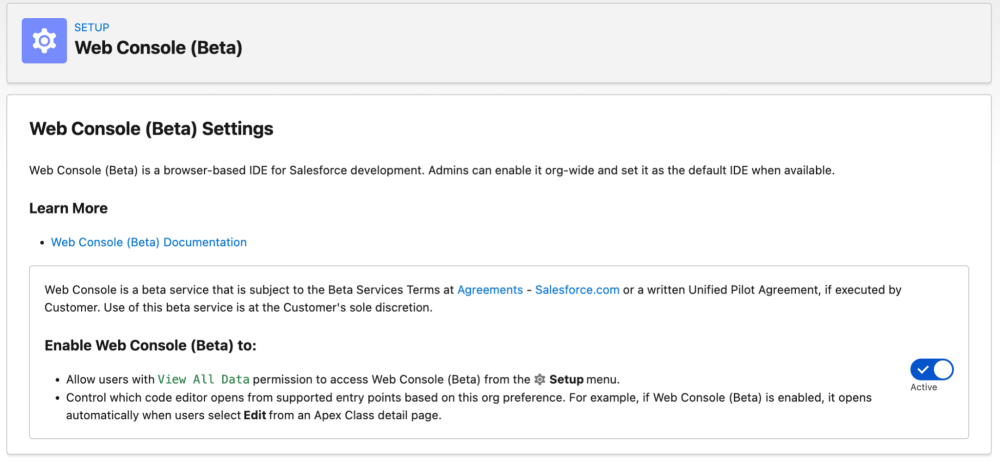
How to enable Web Console (beta)
During the open beta starting April 14, 2026, Web Console will be available across Salesforce orgs and editions through admin opt-in. It will be off by default until an admin enables it from the Web Console Setup page.
To learn how to enable it in your org and get started, see the Web Console (Beta) documentation.
Why this beta is focused
The beta is intentionally scoped around a set of workflows developers will recognize immediately. It delivers value now, while laying the foundation for a broader, unified development experience over time. The near-term emphasis is on embedded workflows and the high-frequency tasks that are often a source of friction for developers today: investigating failures, tracing behavior, checking queries, making quick edits, and validating fixes.
Join us at TDX
Want to see Web Console in action? If you are attending TDX, register to join us in person to see how Web Console helps developers debug, edit, validate, and move faster — right inside Salesforce — in our session:
Build on the Salesforce Platform with Web Console
Build, edit, and validate from your browser with Web Console, the unified Salesforce web environment for Apex, metadata, and in-context editing.
- Master the core capabilities and productivity features of Web Console.
- Transition your daily development workflows from the legacy Developer Console to the modern Web Console.
- Perform metadata management and Apex development directly within the unified web interface.
About the author
Raj Sensharma is a Director of Product Management at Salesforce with over 20 years of experience delivering transformative SaaS, platform, and AI-powered solutions. He’s passionate about building AI-native products that go beyond automation to enable truly agentic experiences. Raj holds an MBA and a Master’s degree in Computer Science from the University of Central Florida. Follow him on LinkedIn.