


 j
jAnalyze Your Data Over Time
Calculate How Long Activities Take
Display the Opportunities Closed This Month
Forecast Future Data Points with timeseries
Combine Data from Multiple Data Streams with cogroup
Replace Null Values with coalesce()
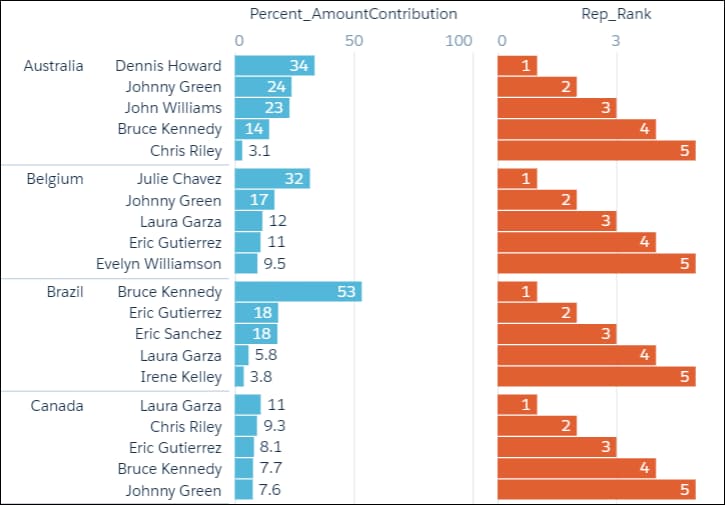
Dynamically Display Your Top Five Reps with Windowing
Append Datasets using union
Calculate the Slope of the Regression Line
Show the Top and Bottom Quartile
Calculate Grand Totals and Subtotals with the rollup Modifier and grouping() Function
Previous Versions