


Windowing Functions
Use SAQL windowing functionality to calculate common business cases such as percent of grand total, moving average, year and quarter growth, and ranking.
Windowing functions allow you to calculate data for a single group using aggregated data from adjacent groups. Windowing doesn’t change the number of rows returned by the query. Windowing aggregates across groups rather than within groups and accepts any valid numerical projection on which to aggregate.
Windowing with an aggregate function uses the following syntax:
1<windowfunction>(<projection expression>) over (<row range> partition by <reset groups> order by <order clause>) as <label>When using ranking functions, use the following syntax:
1<rankfunction> over([..] partition by <reset groups> order by <order clause>) as <label>Where:
| Parameter | Description |
|---|---|
| windowfunction | An aggregate function that supports windowing. Currently supported functions are avg, sum, min, max, count, median, percentile_disc, and percentile_cont. |
| rankfunction | Returns a rank value for each row in a partition. The following ranking functions are supported: rank(), dense_rank(), cume_dist(), and row_number(). Refer to the Ranking Functions section for examples. |
| projection expression | The expression used to generate a projection from the values of specified columns. |
| row range | The row range expression that defines the window. See the following table. |
| reset groups | The columns that reset windowing aggregation when their values change. A reset group of all indicates no reset boundaries for the window aggregation. |
| order clause | Specify columns by which to sort. This action orders the rows before the window function gets evaluated. |
| label | The output column name. |
Row ranges use the following syntax:
| Range | Meaning |
|---|---|
| [.. 0] | From beginning to current row in the reset group. |
| [0 ..] | From current row to the last row in the reset group. |
| [-2 .. 0] | From two rows before the current row. Window covers 3 rows. |
| [0 .. 2] | From current row to 2 rows ahead of current row. Windows covers 3 rows. |
| [-1 .. -1] | One row before the current row. Window includes a single row. |
| [.. -2] | From beginning of reset group to 2 rows before the current row. |
| [..] | Aggregates the entire reset group. |
The order clause is not allowed on expressions where the row range is [..] and the window function is sum, avg, min, or max. For example, sum(sum(Sales)) over([..] partition by Year order by Quarter) is invalid.
Note
Grouped Queries
Windowing functionality is enabled only for grouped queries. The following is not valid:
1a = load "dataset";
2b = foreach a generate sum(sum(sales)) over([.. 0] partition by all order by all);
Multiple Resets and Multiple Orders
Multiple resets and multiple orders are valid. For example:
1sum(sum(Sales)) over([-2 .. 0] partition by (OrderDate_Year, OrderDate_Quarter) order by OrderDate_Year)
2
3sum(sum(Sales)) over([-2 .. 0] partition by (Year, Quarter) order by (Year asc, sum(Sales) desc))
Cogroups
Windowing functions can be used with cogroup queries. For example:
sum(sum(a[Sales])) over([-2 .. 0] partition by (a[Year], a[Quarter]) order by (a[Year] asc, sum(a[Sales]) desc))
Each Windowing function can be used with only 1 cogroup stream. The following is not valid:
1a = load "dataset1";
2b = load "dataset2";
3c = cogroup a by column1, b by column2;
4d = foreach c generate sum(sum(a[sales])) over([.. 0] partition by b[column2] order by all)
To validate the statement, remove the second stream from the cogroup line, b by column2.
Note
Refer to the Aggregate Functions topic for details on function usage.
Example: Dynamically Display Your Top Five Reps
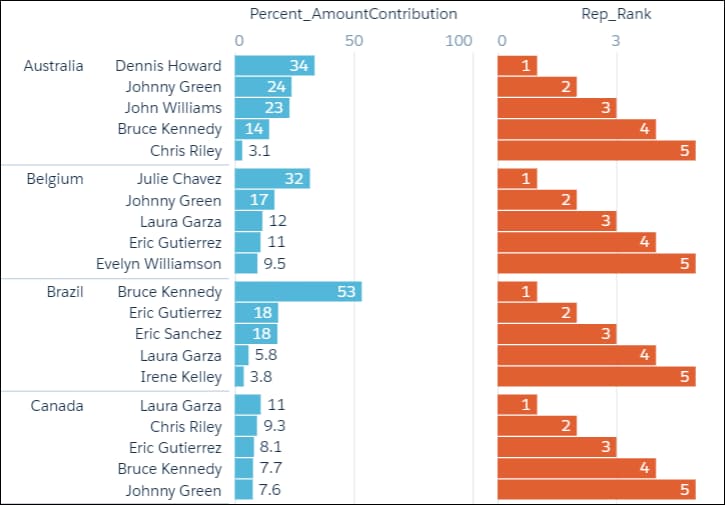
Use windowing to create a chart that dynamically displays your top-five reps for each country. The chart updates continuously as opportunities are won. The example uses windowing to calculate:
- Percentage contribution that each rep made to the total amount, partitioned by country
- Ranking of the rep’s contribution, partitioned by country
These calculations let us display the top-five reps in each country.
1q = load "DTC_Opportunity_SAMPLE";
2q = group q by ('Billing_Country', 'Account_Owner');
3
4q = foreach q generate 'Billing_Country', 'Account_Owner',
5
6-- sum(Amount) is the total amount for a single rep in the current country
7-- sum(sum('Amount') is the total amount for ALL reps in the current country
8-- sum(Amount) / sum(sum('Amount') calculates the percentage that each rep contributed
9-- to the total amount in the current country
10((sum('Amount')/sum(sum('Amount'))
11
12
13-- [..] means "include all records in the partition"
14-- "by Billing_Country" means partition, or group, by country
15over ([..] partition by 'Billing_Country')) * 100) as 'Percent_AmountContribution',
16
17-- rank the percent contribution and partition by the country
18rank() over ([..] partition by ('Billing_Country') order by sum('Amount') desc ) as 'Rep_Rank';
19
20-- filter to include only the top 5 reps
21q = filter q by 'Rep_Rank' <=5;
The resulting graph shows the top-five reps in each country and displays each rep’s ranking.
Example: Running Total (No Reset)
The following query calculates the running total of sum of sales every quarter, with “partition by all” denoting that the sum isn’t reset by any column.
1q = load "dataset";
2q = group q by (OrderDate_Year, OrderDate_Quarter);
3q = foreach q generate OrderDate_Year as Year, OrderDate_Quarter as Quarter, sum(Sales) as sum_amt, sum(sum(Sales)) over([.. 0] partition by all order by (OrderDate_Year, OrderDate_Quarter)) as r_sum;| Year | Quarter | sum_amt | r_sum |
|---|---|---|---|
| 2013 | 1 | 1000 | 1000 |
| 2013 | 2 | 2000 | 3000 |
| 2013 | 3 | 3000 | 6000 |
| 2013 | 4 | 2000 | 8000 |
| 2014 | 1 | 1000 | 9000 |
| 2014 | 2 | 500 | 9500 |
| 2014 | 3 | 9000 | 18500 |
| 2014 | 4 | 3000 | 21500 |
| 2015 | 1 | 500 | 22000 |
| 2015 | 2 | 500 | 22500 |
| 2015 | 3 | 200 | 22700 |
| 2015 | 4 | 400 | 23100 |
Example: Running Totals By Year
Running total resets on every year.
1q = load "dataset";
2q = group q by (OrderDate_Year, OrderDate_Quarter);
3q = foreach q generate OrderDate_Year as Year, OrderDate_Quarter as Quarter, sum(Sales) as sum_amt, sum(sum(Sales)) over([.. 0] partition by OrderDate_Year order by (OrderDate_Year, OrderDate_Quarter)) as r_sum;| Year | Quarter | sum_amt | r_sum |
|---|---|---|---|
| 2013 | 1 | 1000 | 1000 |
| 2013 | 2 | 2000 | 3000 |
| 2013 | 3 | 3000 | 6000 |
| 2013 | 4 | 2000 | 8000 |
| 2014 | 1 | 1000 | 1000 |
| 2014 | 2 | 500 | 1500 |
| 2014 | 3 | 9000 | 10500 |
| 2014 | 4 | 3000 | 13500 |
| 2015 | 1 | 500 | 500 |
| 2015 | 2 | 500 | 100 |
| 2015 | 3 | 200 | 1200 |
| 2015 | 4 | 400 | 1600 |
Example: Min Sales Trailing 3 Quarters
Finds the moving minimum values in the window of last two rows to current row.
1q = load "dataset";
2q = group q by (OrderDate_Year, OrderDate_Quarter);
3q = foreach q generate OrderDate_Year as Year, OrderDate_Quarter as Quarter, sum(Sales) as sumSales, min(sum(Sales)) over([-2 .. 0] partition by OrderDate_Year order by (OrderDate_Year, OrderDate_Quarter)) as m_min;| Year | Quarter | sumSales | m_min |
|---|---|---|---|
| 2013 | 1 | 1000 | 1000 |
| 2013 | 2 | 2000 | 1000 |
| 2013 | 3 | 3000 | 1000 |
| 2013 | 4 | 2000 | 2000 |
| 2014 | 1 | 1000 | 1000 |
| 2014 | 2 | 500 | 500 |
| 2014 | 3 | 9000 | 500 |
| 2014 | 4 | 3000 | 500 |
| 2015 | 1 | 4000 | 4000 |
| 2015 | 2 | 500 | 500 |
| 2015 | 3 | 200 | 200 |
| 2015 | 4 | 400 | 200 |
Example: Percentage Total
This query calculates the percentage of the quarter’s sales for the year. Row range [..] calculates the subtotals of each year, which is used in the formula to calculate the percentage.
1q = load "dataset";
2q = group q by (OrderDate_Year, OrderDate_Quarter);
3q = foreach q generate OrderDate_Year as Year, OrderDate_Quarter as Quarter, sum(Sales) as sumSales, (sum(Sales) * 100) / sum(sum(Sales)) over([..] partition by OrderDate_Year) as p_tot;| Year | Quarter | sumSales | p_tot |
|---|---|---|---|
| 2013 | 1 | 1000 | 12.5% |
| 2013 | 2 | 2000 | 25% |
| 2013 | 3 | 3000 | 37.5% |
| 2013 | 4 | 2000 | 25% |
| 2014 | 1 | 1000 | 7.41% |
| 2014 | 2 | 500 | 3.70% |
| 2014 | 3 | 9000 | 66.67% |
| 2014 | 4 | 3000 | 22.22% |
| 2015 | 1 | 500 | 31.25% |
| 2015 | 2 | 500 | 31.25% |
| 2015 | 3 | 200 | 12.50% |
| 2015 | 4 | 400 | 25% |
Example: Differences Along Year
This query calculates the growth of sales compared with the previous quarter, with [-1 .. -1] referring to the quarter before the quarter on the row. The blank spaces in the result table represent null values.
1q = load "dataset";
2q = group q by (OrderDate_Year, OrderDate_Quarter);
3q = foreach q generate OrderDate_Year as Year, OrderDate_Quarter as Quarter, sum(Sales) as sumSales, sum(Sales) - sum(sum(Sales)) over([-1 .. -1] partition by OrderDate_Quarter order by (OrderDate_Year, OrderDate_Quarter)) as diff;| Year | Quarter | sumSales | diff |
|---|---|---|---|
| 2013 | 1 | 1000 | |
| 2013 | 2 | 2000 | 1000 |
| 2013 | 3 | 3000 | 1000 |
| 2013 | 4 | 2000 | -1000 |
| 2014 | 1 | 1000 | |
| 2014 | 2 | 500 | -500 |
| 2014 | 3 | 9000 | 8500 |
| 2014 | 4 | 3000 | -6000 |
| 2015 | 1 | 500 | |
| 2015 | 2 | 500 | 0 |
| 2015 | 3 | 200 | -300 |
| 2015 | 4 | 400 | 200 |
Ranking Functions
| Function | Description |
|---|---|
rank() | Assigns rank based on order. Repeats rank when the value is the same, and skips as many on the next non-match. |
dense_rank() | Same as rank() but doesn’t skip values on previous repetitions. |
cume_dist() | Calculates the cumulative distribution (relative position) of the data in the reset group. |
row_number() | Assigns a number incremented by 1 for every row in the reset group. |
Example: Ranking Functions
The following query uses rank() to rank quarters by sales within each year.
1q = load "dataset";
2q = group q by (Year, Quarter);
3q = foreach q generate Year, Quarter, sum(Sales) as sum_amt, rank() over([..] partition by Year order by sum(Sales)) as rank;
The following table also shows result columns as if the dense_rank(), cume_dist(), and row_number() functions were substituted for rank() in the previous code.
| Year | Quarter | sum_amt | rank | dense_rank | cume_dist | row_number |
|---|---|---|---|---|---|---|
| 2013 | 1 | 1000 | 1 | 1 | 0.25 | 1 |
| 2013 | 2 | 2000 | 2 | 2 | 0.75 | 2 |
| 2013 | 4 | 2000 | 2 | 2 | 0.75 | 3 |
| 2013 | 3 | 3000 | 4 | 3 | 1 | 4 |
| 2014 | 2 | 500 | 1 | 1 | 0.25 | 1 |
| 2014 | 1 | 1000 | 2 | 2 | 0.5 | 2 |
| 2014 | 4 | 3000 | 3 | 3 | 0.75 | 3 |
| 2014 | 3 | 9000 | 4 | 4 | 1 | 4 |
| 2015 | 1 | 500 | 1 | 1 | 0.5 | 1 |
| 2015 | 2 | 500 | 1 | 1 | 0.5 | 2 |
| 2015 | 4 | 600 | 3 | 2 | 0.75 | 3 |
| 2015 | 3 | 700 | 4 | 3 | 1 | 4 |
This query shows the top 3 performing quarters in a year.
1q = load "dataset";
2q = group q by (Year, Quarter);
3q = foreach q generate Year, Quarter, sum(Sales) as sum_amt, rank() over([..] partition by Year order by sum(Sales)) as rank;
4q = filter q by rank <= 3;| Year | Quarter | sumSales | rank |
|---|---|---|---|
| 2013 | 1 | 1000 | 1 |
| 2013 | 2 | 2000 | 2 |
| 2013 | 4 | 2000 | 2 |
| 2014 | 2 | 500 | 1 |
| 2014 | 1 | 1000 | 2 |
| 2014 | 4 | 3000 | 3 |
| 2015 | 1 | 500 | 1 |
| 2015 | 2 | 600 | 1 |
| 2015 | 4 | 600 | 3 |
Example: Percentile
This query shows the 95th percentile.
1q = load "Oppty_Products_Scored";
2q = group q by (ProductName);
3q = foreach q generate ProductName, sum(TotalPrice) as sum_Price, percentile_cont(0.95) within group (order by 'TotalPrice') as 'sum_95Percentile';
4q = limit q 5;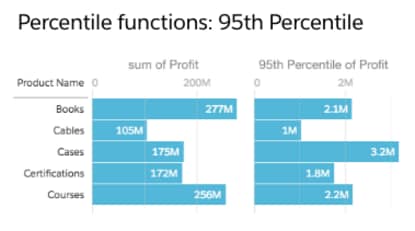
Refer to the Aggregate Functions topic for details on function usage.
See Also
 j
j