Visualforce Developer’s Guide
 j
j
No Results
Search Tips:
- Please consider misspellings
- Try different search keywords
Newer Version Available
Providing Chart Data via a Controller Method
The most straightforward way to provide data to a chart
is using a Visualforce expression that references a controller method. Simply reference
the controller in the <apex:chart> data attribute.
On the server side, write a controller method that returns a List of objects, which can be your own Apex wrapper objects as in A Simple Charting Example, sObjects, or AggregateResult objects. The method is evaluated server-side, and the results serialized to JSON. On the client, these results are used directly by <apex:chart>, with no further opportunity for processing.
To illustrate this technique with sObjects, here is a simple controller that returns a list of Opportunities, and a bar chart for their amounts:
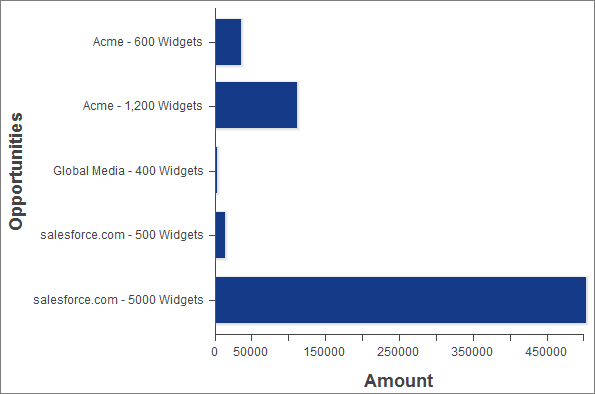
There are two important things to notice about this example:
- The Visualforce chart components access the data attributes from a List of Opportunity sObjects the same way as from the simple Data object used in A Simple Charting Example.
- The object field names used as data attributes are case-sensitive in JavaScript while field names in Apex and Visualforce are case-insensitive. Be careful to use the precise field name in the fields, xField, and yField attributes of axes and data series components, or your chart will silently fail.