Visualforce Developer’s Guide
 j
jNewer Version Available
Providing Chart Data via a Controller Method
The most straightforward way to provide data to a chart
is using a Visualforce expression that references a controller method. Simply reference
the controller in the <apex:chart> data attribute.
On the server side, write a controller method that returns a List of objects, which can be your own Apex wrapper objects as in A Simple Charting Example, sObjects, or AggregateResult objects. The method is evaluated server-side, and the results serialized to JSON. On the client, these results are used directly by <apex:chart>, with no further opportunity for processing.
To illustrate this technique with sObjects, here is a simple controller that returns a list of Opportunities, and a bar chart for their amounts:
1swfobject.registerObject("clippy.codeblock-0", "9");
2
3
4
5
6
7
8
9
10
11
12
13
14
15
16
17public class OppsController {
18
19    // Get a set of Opportunities
20    public ApexPages.StandardSetController setCon {
21        get {
22            if(setCon == null) {
23                setCon = new ApexPages.StandardSetController(Database.getQueryLocator(
24                      [SELECT name, type, amount, closedate FROM Opportunity]));
25                setCon.setPageSize(5);
26            }
27            return setCon;
28        }
29        set;
30    }
31
32    public List<Opportunity> getOpportunities() {
33         return (List<Opportunity>) setCon.getRecords();
34    }
35}
361swfobject.registerObject("clippy.codeblock-1", "9");
2
3
4
5
6
7
8
9
10
11
12
13
14
15
16
17<apex:page controller="OppsController">
18 <apex:chart data="{!Opportunities}" width="600" height="400">
19 <apex:axis type="Category" position="left" fields="Name" title="Opportunities"/>
20 <apex:axis type="Numeric" position="bottom" fields="Amount" title="Amount"/>
21 <apex:barSeries orientation="horizontal" axis="bottom"
22 xField="Name" yField="Amount"/>
23 </apex:chart>
24 <apex:dataTable value="{!Opportunities}" var="opp">
25 <apex:column headerValue="Opportunity" value="{!opp.name}"/>
26 <apex:column headerValue="Amount" value="{!opp.amount}"/>
27 </apex:dataTable>
28</apex:page>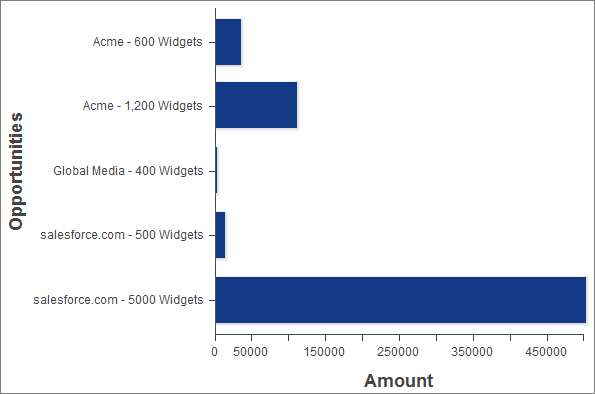
There are two important things to notice about this example:
- The Visualforce chart components access the data attributes from a List of Opportunity sObjects the same way as from the simple Data object used in A Simple Charting Example.
- The object field names used as data attributes are case-sensitive in JavaScript while field names in Apex and Visualforce are case-insensitive. Be careful to use the precise field name in the fields, xField, and yField attributes of axes and data series components, or your chart will silently fail.