Force.com Apex Code Developer's Guide
 j
j
No Results
Search Tips:
- Please consider misspellings
- Try different search keywords
Newer Version Available
Understanding the Debug Log
- Database changes
- HTTP callouts
- Apex errors
- Resources used by Apex
- Automated workflow processes, such as:
- Workflow rules
- Assignment rules
- Approval processes
- Validation rules
You can retain and manage the debug logs for specific users.
To view saved debug logs, from Setup, click or .
- Once a user is added, that user can record up to 20 debug logs. After a user reaches this limit, debug logs stop being recorded for that user. Click Reset on the Monitoring Debug logs page to reset the number of logs for that user back to 20. Any existing logs are not overwritten.
- Each debug log can only be 2 MB. Debug logs that are larger than 2 MB are reduced in size by removing older log lines, such as log lines for earlier System.debug statements. The log lines can be removed from any location, not just the start of the debug log.
- Each organization can retain up to 50 MB of debug logs. Once your organization has reached 50 MB of debug logs, the oldest debug logs start being overwritten.
Inspecting the Debug Log Sections
After you generate a debug log, the type and amount of information listed depends on the filter values you set for the user. However, the format for a debug log is always the same.
- Header
- The header contains the following information:
- The version of the API used during the transaction.
- The log category and level used to generate the log. For example:
- The following is an example of a header:
125.0 APEX_CODE,DEBUG;APEX_PROFILING,INFO;CALLOUT,INFO;DB,INFO;SYSTEM,DEBUG;VALIDATION,INFO;VISUALFORCE,INFO;
2WORKFLOW,INFO
In this example, the API version is 25.0, and the following debug log categories and levels have been set:Apex Code DEBUG Apex Profiling INFO Callout INFO Database INFO System DEBUG Validation INFO Visualforce INFO Workflow INFO - Execution Units
- An execution unit is equivalent to a transaction. It contains everything that occurred within the transaction. The execution is delimited by EXECUTION_STARTED and EXECUTION_FINISHED.
- Code Units
- A code unit is a discrete unit of work within a transaction. For example, a trigger is one unit of code, as is a webService method, or a validation rule.
- Units of code are indicated by CODE_UNIT_STARTED and CODE_UNIT_FINISHED. Units
of work can embed other units of work. For example:
1EXECUTION_STARTED 2CODE_UNIT_STARTED|[EXTERNAL]execute_anonymous_apex 3CODE_UNIT_STARTED|[EXTERNAL]MyTrigger on Account trigger event BeforeInsert for [new] 4CODE_UNIT_FINISHED <-- The trigger ends 5CODE_UNIT_FINISHED <-- The executeAnonymous ends 6EXECUTION_FINISHED - Units of code include, but are not limited to, the following:
- Triggers
- Workflow invocations and time-based workflow
- Validation rules
- Approval processes
- Apex lead convert
- @future method invocations
- Web service invocations
- executeAnonymous calls
- Visualforce property accesses on Apex controllers
- Visualforce actions on Apex controllers
- Execution of the batch Apex start and finish methods, as well as each execution of the execute method
- Execution of the Apex System.Schedule execute method
- Incoming email handling
- Log Lines
- Log lines are Included inside units of code and indicate what
code or rules are being executed. Log lines can also be messages specifically
written to the debug log. For example:
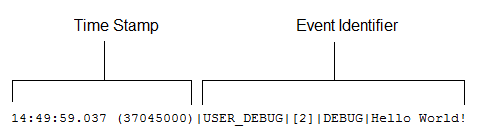
- Log lines are made up of a set of fields, delimited by a pipe
(|). The format is:
- timestamp: consists of the time when the event occurred and a value between parentheses. The time is in the user's time zone and in the format HH:mm:ss.SSS. The value represents the time elapsed in milliseconds since the start of the request. The elapsed time value is excluded from logs reviewed in the Developer Console.
- event identifier: consists of the specific event that triggered the debug log being written to, such as SAVEPOINT_RESET or VALIDATION_RULE, and any additional information logged with that event, such as the method name or the line and character number where the code was executed.
- Additional Log Data
- In addition, the log contains the following information:
- Cumulative resource usage is logged at the end of many code units, such as triggers, executeAnonymous, batch Apex message processing, @future methods, Apex test methods, Apex web service methods, and Apex lead convert.
- Cumulative profiling information is logged once at the end of the transaction and contains information about the most expensive queries (used the most resources), DML invocations, and so on.
122.0 APEX_CODE,DEBUG;APEX_PROFILING,INFO;CALLOUT,INFO;DB,INFO;SYSTEM,DEBUG;VALIDATION,INFO;VISUALFORCE,INFO;
2WORKFLOW,INFO
311:47:46.030 (30064000)|EXECUTION_STARTED
411:47:46.030 (30159000)|CODE_UNIT_STARTED|[EXTERNAL]|TRIGGERS
511:47:46.030 (30271000)|CODE_UNIT_STARTED|[EXTERNAL]|01qD00000004JvP|myAccountTrigger on Account trigger event BeforeUpdate for [001D000000IzMaE]
611:47:46.038 (38296000)|SYSTEM_METHOD_ENTRY|[2]|System.debug(ANY)
711:47:46.038 (38450000)|USER_DEBUG|[2]|DEBUG|Hello World!
811:47:46.038 (38520000)|SYSTEM_METHOD_EXIT|[2]|System.debug(ANY)
911:47:46.546 (38587000)|CUMULATIVE_LIMIT_USAGE
1011:47:46.546|LIMIT_USAGE_FOR_NS|(default)|
11  Number of SOQL queries: 0 out of 100
12  Number of query rows: 0 out of 50000
13  Number of SOSL queries: 0 out of 20
14  Number of DML statements: 0 out of 150
15  Number of DML rows: 0 out of 10000
16  Number of code statements: 1 out of 200000
17  Maximum heap size: 0 out of 6000000
18  Number of callouts: 0 out of 10
19  Number of Email Invocations: 0 out of 10
20  Number of fields describes: 0 out of 100
21  Number of record type describes: 0 out of 100
22  Number of child relationships describes: 0 out of 100
23  Number of picklist describes: 0 out of 100
24  Number of future calls: 0 out of 10
25
2611:47:46.546|CUMULATIVE_LIMIT_USAGE_END
27
2811:47:46.038 (38715000)|CODE_UNIT_FINISHED|myAccountTrigger on Account trigger event BeforeUpdate for [001D000000IzMaE]
2911:47:47.154 (1154831000)|CODE_UNIT_FINISHED|TRIGGERS
3011:47:47.154 (1154881000)|EXECUTION_FINISHED
Setting Debug Log Filters for Apex Classes and Triggers
Debug log filtering provides a mechanism for fine-tuning the log verbosity at the trigger and class level. This is especially helpful when debugging Apex logic. For example, to evaluate the output of a complex process, you can raise the log verbosity for a given class while turning off logging for other classes or triggers within a single request.
When you override the debug log levels for a class or trigger, these debug levels also apply to the class methods that your class or trigger calls and the triggers that get executed as a result. All class methods and triggers in the execution path inherit the debug log settings from their caller, unless they have these settings overridden.
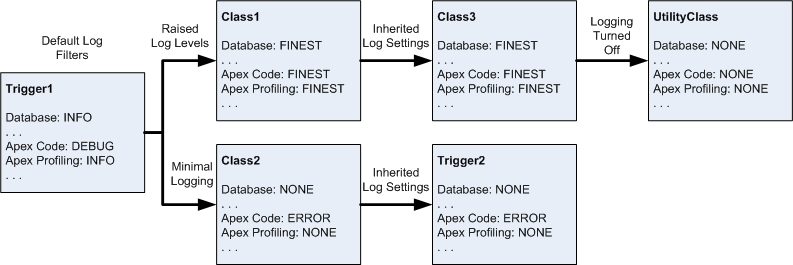
The following diagram illustrates overriding debug log levels at the class and trigger level. For this scenario, suppose Class1 is causing some issues that you would like to take a closer look at. To this end, the debug log levels of Class1 are raised to the finest granularity. Class3 doesn't override these log levels, and therefore inherits the granular log filters of Class1. However, UtilityClass has already been tested and is known to work properly, so it has its log filters turned off. Similarly, Class2 isn't in the code path that causes a problem, therefore it has its logging minimized to log only errors for the Apex Code category. Trigger2 inherits these log settings from Class2.
- Trigger1 calls a method
of Class1 and another method
of Class2. For example:
1trigger Trigger1 on Account (before insert) { 2 Class1.someMethod(); 3 Class2.anotherMethod(); 4} - Class1 calls a method
of Class3, which in turn calls
a method of a utility class. For example:
1public class Class1 { 2 public static void someMethod() { 3 Class3.thirdMethod(); 4 } 5} 6 7public class Class3 { 8 public static void thirdMethod() { 9 UtilityClass.doSomething(); 10 } 11} - Class2 causes a trigger, Trigger2, to be executed. For example:
1public class Class2 {
2    public static void anotherMethod() {
3        // Some code that causes Trigger2 to be fired.
4    }
5}
- From a class or trigger detail page, click Log Filters.
- Click Override Log Filters.
The log filters are set to the default log levels.
- Choose the log level desired for each log category.
To learn more about debug log categories, debug log levels, and debug log events, see Setting Debug Log Filters.