Apex Developer Guide
 j
jNewer Version Available
Debug Log
- Database changes
- HTTP callouts
- Apex errors
- Resources used by Apex
- Automated workflow processes, such as:
- Workflow rules
- Assignment rules
- Approval processes
- Validation rules
You can retain and manage debug logs for specific users, including yourself, and for classes and triggers. Setting class and trigger trace flags doesn’t cause logs to be generated or saved. Class and trigger trace flags override other logging levels, including logging levels set by user trace flags, but they don’t cause logging to occur. If logging is enabled when classes or triggers execute, logs are generated at the time of execution.
To view a debug log from Setup, enter Debug Logs in the Quick Find box, then select Debug Logs. Then click View next to the debug log that you want to examine. Click Download to download the log as an XML file.
Debug Log Limits
Debug logs have the following limits.
- Each debug log must be 20 MB or smaller. Debug logs that are larger than 20 MB are reduced in size by removing older log lines, such as log lines for earlier System.debug statements. The log lines can be removed from any location, not just the start of the debug log.
- System debug logs are retained for 24 hours. Monitoring debug logs are retained for seven days.
- If you generate more than 1,000 MB of debug logs in a 15-minute window, your trace flags are disabled. We send an email to the users who last modified the trace flags, informing them that they can re-enable the trace flag in 15 minutes.
- When your org accumulates more than 1,000 MB of debug logs, we prevent users in the org from adding or editing trace flags. To add or edit trace flags so that you can generate more logs after you reach the limit, delete some debug logs.
Inspecting the Debug Log Sections
After you generate a debug log, the type and amount of information listed depends on the filter values you set for the user. However, the format for a debug log is always the same.
- Header
- The header contains the following information.
- The version of the API used during the transaction.
- The log category and level used to generate the log. For example:
- The following is an example of a
header.
161.0 APEX_CODE,DEBUG;APEX_PROFILING,INFO;CALLOUT,INFO;DB,INFO;SYSTEM,DEBUG;VALIDATION,INFO;VISUALFORCE,INFO;
2WORKFLOW,INFO
In this example, the API version is 61.0, and the following debug log categories and levels have been set.Apex Code DEBUG Apex Profiling INFO Callout INFO Database INFO System DEBUG Validation INFO Visualforce INFO Workflow INFO - Execution Units
- An execution unit is equivalent to a transaction. It contains everything that occurred within the transaction. EXECUTION_STARTED and EXECUTION_FINISHED delimit an execution unit.
- Code Units
- A code unit is a discrete unit of work within a transaction. For example, a trigger is one unit of code, as is a webservice method or a validation rule.
-
CODE_UNIT_STARTED and CODE_UNIT_FINISHED delimit units of code. Units of work
can embed other units of work. For example:
1EXECUTION_STARTED 2CODE_UNIT_STARTED|[EXTERNAL]execute_anonymous_apex 3CODE_UNIT_STARTED|[EXTERNAL]MyTrigger on Account trigger event BeforeInsert for [new]|__sfdc_trigger/MyTrigger 4CODE_UNIT_FINISHED <-- The trigger ends 5CODE_UNIT_FINISHED <-- The executeAnonymous ends 6EXECUTION_FINISHED - Units of code include, but aren’t limited to, the following:
- Triggers
- Workflow invocations and time-based workflow
- Validation rules
- Approval processes
- Apex lead convert
- @future method invocations
- Web service invocations
- executeAnonymous calls
- Visualforce property access on Apex controllers
- Visualforce actions on Apex controllers
- Execution of the batch Apex start and finish methods, and each execution of the execute method
- Execution of the Apex System.Schedule execute method
- Incoming email handling
- Log Lines
- Log lines are included inside units of code and indicate which code or rules are
being executed. Log lines can also be messages written to the debug log. For example:
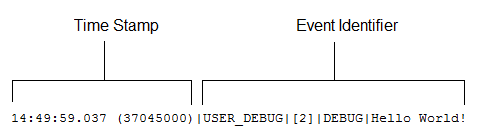
- Log lines are made up of a set of fields, delimited by a pipe (|). The format is:
- timestamp: Consists of the time when the event occurred and a value between parentheses. The time is in the user’s time zone and in the format HH:mm:ss.SSS. The value in parentheses represents the time elapsed in nanoseconds since the start of the request. The elapsed time value is excluded from logs reviewed in the Developer Console when you use the Execution Log view. However, you can see the elapsed time when you use the Raw Log view. To open the Raw Log view, from the Developer Console’s Logs tab, right-click the name of a log and select Open Raw Log.
-
event identifier: Specifies the event that triggered the debug log
entry (such as SAVEPOINT_RESET or VALIDATION_RULE).
Also includes additional information logged with that event, such as the method name or the line and character number where the code was executed. If a line number can’t be located, [EXTERNAL] is logged instead. For example, [EXTERNAL] is logged for built-in Apex classes or code that’s in a managed package.
For some events (CODE_UNIT_STARTED, CODE_UNIT_FINISHED, VF_APEX_CALL_START, VF_APEX_CALL_END, CONSTRUCTOR_ENTRY, and CONSTRUCTOR_EXIT), the end of the event identifier includes a pipe (|) followed by a typeRef for an Apex class or trigger.
For a trigger, the typeRef begins with the SFDC trigger prefix __sfdc_trigger/. For example, __sfdc_trigger/YourTriggerName or __sfdc_trigger/YourNamespace/YourTriggerName.
For a class, the typeRef uses the format YourClass, YourClass$YourInnerClass,, or YourNamespace/YourClass$YourInnerClass.
- More Log Data
- In addition, the log contains the following information.
- Cumulative resource usage is logged at the end of many code units. Among these code units are triggers, executeAnonymous, batch Apex message processing, @future methods, Apex test methods, Apex web service methods, and Apex lead convert.
- Cumulative profiling information is logged once at the end of the transaction and contains information about DML invocations, expensive queries, and so on. “Expensive” queries use resources heavily.
- Heap usage is accurately reported in the debug log and an exception is thrown whenever an Apex Heap Size error occurs. At other times, the heap size shown in the debug log is the largest heap size that was calculated during the transaction. To reduce the overhead on small transactions, minimal heap usage doesn’t warrant an accurate calculation and is reported as 0(zero).
137.0 APEX_CODE,FINEST;APEX_PROFILING,INFO;CALLOUT,INFO;DB,INFO;SYSTEM,DEBUG;
2    VALIDATION,INFO;VISUALFORCE,INFO;WORKFLOW,INFO
3Execute Anonymous: System.debug('Hello World!');
416:06:58.18 (18043585)|USER_INFO|[EXTERNAL]|005D0000001bYPN|devuser@example.org|
5    Pacific Standard Time|GMT-08:00
616:06:58.18 (18348659)|EXECUTION_STARTED
716:06:58.18 (18383790)|CODE_UNIT_STARTED|[EXTERNAL]|execute_anonymous_apex
816:06:58.18 (23822880)|HEAP_ALLOCATE|[72]|Bytes:3
916:06:58.18 (24271272)|HEAP_ALLOCATE|[77]|Bytes:152
1016:06:58.18 (24691098)|HEAP_ALLOCATE|[342]|Bytes:408
1116:06:58.18 (25306695)|HEAP_ALLOCATE|[355]|Bytes:408
1216:06:58.18 (25787912)|HEAP_ALLOCATE|[467]|Bytes:48
1316:06:58.18 (26415871)|HEAP_ALLOCATE|[139]|Bytes:6
1416:06:58.18 (26979574)|HEAP_ALLOCATE|[EXTERNAL]|Bytes:1
1516:06:58.18 (27384663)|STATEMENT_EXECUTE|[1]
1616:06:58.18 (27414067)|STATEMENT_EXECUTE|[1]
1716:06:58.18 (27458836)|HEAP_ALLOCATE|[1]|Bytes:12
1816:06:58.18 (27612700)|HEAP_ALLOCATE|[50]|Bytes:5
1916:06:58.18 (27768171)|HEAP_ALLOCATE|[56]|Bytes:5
2016:06:58.18 (27877126)|HEAP_ALLOCATE|[64]|Bytes:7
2116:06:58.18 (49244886)|USER_DEBUG|[1]|DEBUG|Hello World!
2216:06:58.49 (49590539)|CUMULATIVE_LIMIT_USAGE
2316:06:58.49 (49590539)|LIMIT_USAGE_FOR_NS|(default)|
24  Number of SOQL queries: 0 out of 100
25  Number of query rows: 0 out of 50000
26  Number of SOSL queries: 0 out of 20
27  Number of DML statements: 0 out of 150
28  Number of DML rows: 0 out of 10000
29  Maximum CPU time: 0 out of 10000
30  Maximum heap size: 0 out of 6000000
31  Number of callouts: 0 out of 100
32  Number of Email Invocations: 0 out of 10
33  Number of future calls: 0 out of 50
34  Number of queueable jobs added to the queue: 0 out of 50
35  Number of Mobile Apex push calls: 0 out of 10
36
3716:06:58.49 (49590539)|CUMULATIVE_LIMIT_USAGE_END
38
3916:06:58.18 (52417923)|CODE_UNIT_FINISHED|execute_anonymous_apex
4016:06:58.18 (54114689)|EXECUTION_FINISHED
Setting Debug Log Filters for Apex Classes and Triggers
Debug log filtering provides a mechanism for fine-tuning the log verbosity at the trigger and class level. This is especially helpful when debugging Apex logic. For example, to evaluate the output of a complex process, you can raise the log verbosity for a given class while turning off logging for other classes or triggers within a single request.
When you override the debug log levels for a class or trigger, these debug levels also apply to the class methods that your class or trigger calls and the triggers that get executed as a result. All class methods and triggers in the execution path inherit the debug log settings from their caller, unless they have these settings overridden.
The following diagram illustrates overriding debug log levels at the class and trigger level. For this scenario, suppose Class1 is causing some issues that you want to take a closer look at. To this end, the debug log levels of Class1 are raised to the finest granularity. Class3 doesn't override these log levels, and therefore inherits the granular log filters of Class1. However, UtilityClass has already been tested and is known to work properly, so it has its log filters turned off. Similarly, Class2 isn't in the code path that causes a problem, therefore it has its logging minimized to log only errors for the Apex Code category. Trigger2 inherits these log settings from Class2.

-
Trigger1 calls a method of Class1 and another method of Class2. For
example:
1trigger Trigger1 on Account (before insert) { 2 Class1.someMethod(); 3 Class2.anotherMethod(); 4} -
Class1 calls a method of Class3, which in turn calls a method of a utility
class. For
example:
1public class Class1 { 2 public static void someMethod() { 3 Class3.thirdMethod(); 4 } 5} 6 7public class Class3 { 8 public static void thirdMethod() { 9 UtilityClass.doSomething(); 10 } 11} -
Class2 causes a trigger, Trigger2, to be executed. For
example:
1public class Class2 {
2    public static void anotherMethod() {
3        // Some code that causes Trigger2 to be fired.
4    }
5}