


Force.com Platform Fundamentals
 j
jTry It Out: Create a Summary Report
To create our summary report, we'll start by opening the report builder, a powerful visual editor for reports.
- On the Reports tab, click New Report.
The first step in creating a report is choosing the right report type. A report type defines the set of records and fields available to a report based on the relationships between a primary object and its related objects. Reports display only records that meet the criteria defined in the report type. Your administrators may have set up custom report types for you, or you can select from the available standard report types.
To help with navigation in this screen, all objects and relationships are grouped in categories like Accounts & Contacts or Customer Support Reports. The custom objects and relationships that we built for our Recruiting app can be found in Other Reports.
- From the Create New Report page, select the Other Reports category.
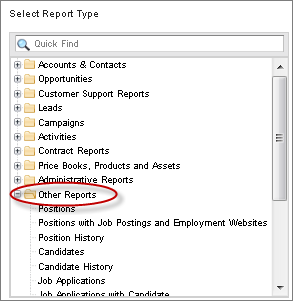
Objects that have a many-to-one relationship with another object, like Job Applications and Positions, can either be selected on their own or in the context of their relationship with the other object. For example, if we select Job Applications with Position, our report will count job application records, but can filter, group, or display fields from the related position records as well. This will come in handy a little later when we build reports that count job application records. But because we need to count position records in our report and positions aren't on the many side of a relationship, we'll stick with a standalone positions report for now.
- Select Positions.
- Click Create.
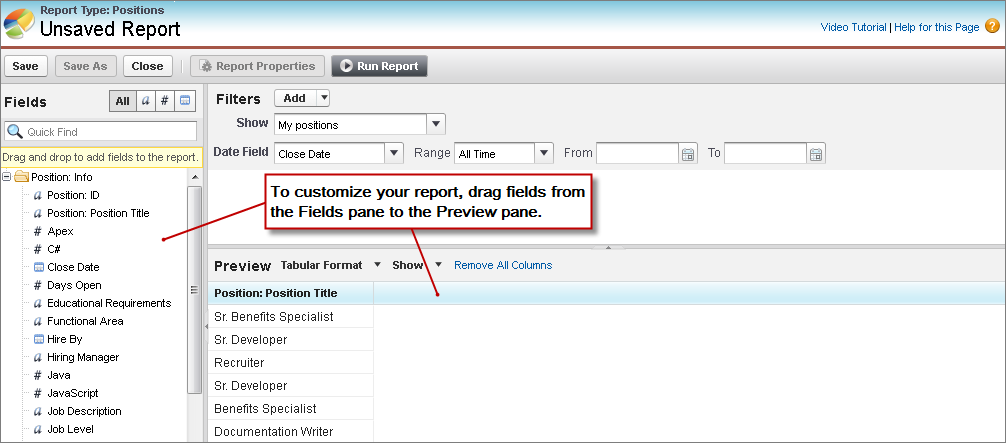
Now that we've chosen the report type, we can customize the report. Note that we can't go back and change the report type. To do that, you have to start with a whole new report. The report builder's Preview pane displays a limited set of data; we can also run the report at any time to see if we have the results we're looking for. For example, let's see what a baseline positions report looks like without any customizations.
- Click Run Report.
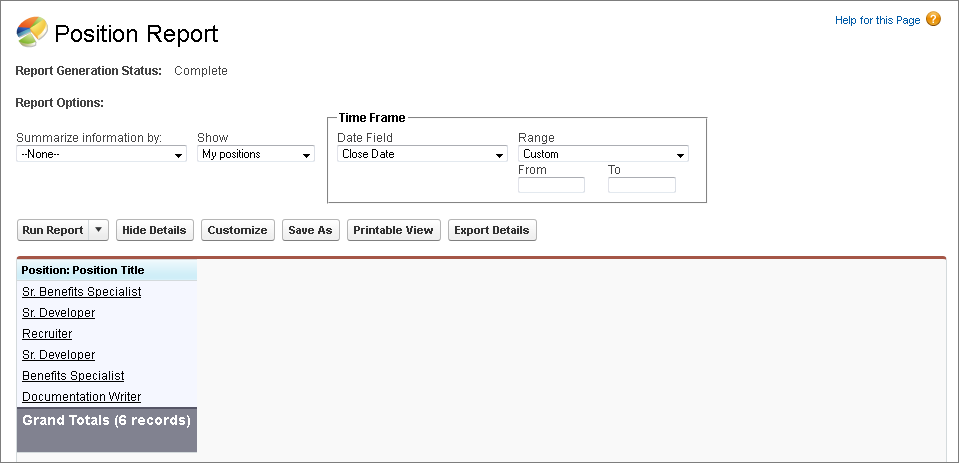
As you can see, without specifying any details, we already have a list of position records with a Grand Total at the bottom. This is the equivalent of what we might see if we were creating a tabular report without additional columns. Now let's take this basic report to the next level.
- Click Customize to return to the report builder.
When creating a new report, we first need to choose the format of the report that we want to create. The default is tabular. Because we want to group rows of open positions by functional area, we'll create a summary report.
- Click Tabular Format and select Summary to change the format.
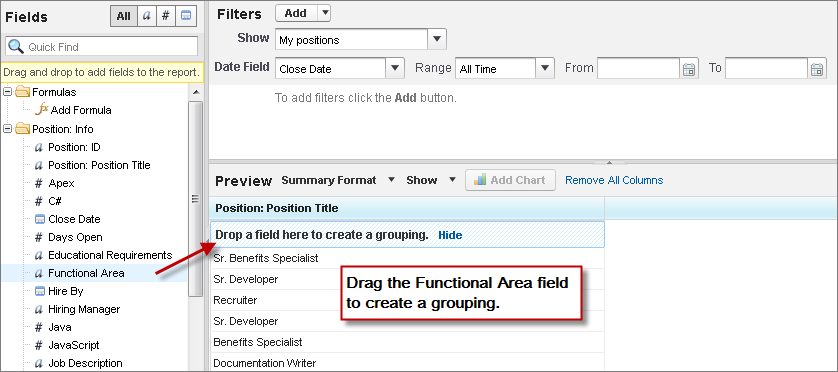
Now we want to group our rows of data by the Functional Area field.
- Find Functional Area in the Fields pane and drag it to the grouping drop zone in the Preview pane. When you have lots of fields, using Quick Find is usually fastest.
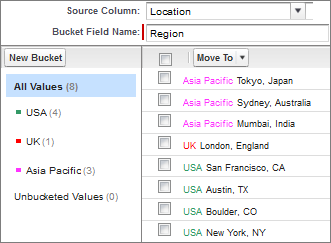
Say we want to see positions also grouped by region. While the Location field gives us city and state, we want to group data geographically by regions, like USA, UK, and Asia Pacific. By categorizing the location field into buckets, we get a field that can be used for the grouping.
- Drag Location from the Field pane into the preview after Position Title.
- Click
 on Location, and select Bucket this Field.
 - Type Region in the Bucket Field Name.
- Click New Bucket, type USA, and press Enter.
- Select:
- San Francisco, CA
- Austin, TX
- Boulder, CO
- New York, NY
- Click Move To, and from its drop-down select USA.
- Click New Bucket, type UK, and press Enter.
- Move London, England into the UK category.
- Move the remaining items into an Asia Pacific bucket.
- Click OK.
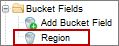
We're closer now! Our report still only lists position titles, but now they're grouped by functional areas and by region. Also, each grouping has a record count subtotal in parentheses. These counts will be the basis of the pie chart that we'll add later.