Force.com IDE Developer Guide
 j
jTest Your Debugger Setup
To make sure that everything is functioning properly, create a
simple Apex class, set a breakpoint in your code, and then hit the breakpoint using
Execute Anonymous.
-
Create an Apex class called SampleClass
with this content.
1public class SampleClass { 2 public void level1(Integer depth1) { 3 level2(2); 4 } 5 6 public void level2(Integer depth2) { 7 level3(3); 8 } 9 10 public void level3(Integer depth3) { 11 System.debug('Placeholder for setting breakpoint'); 12 } 13} - Save the class.
-
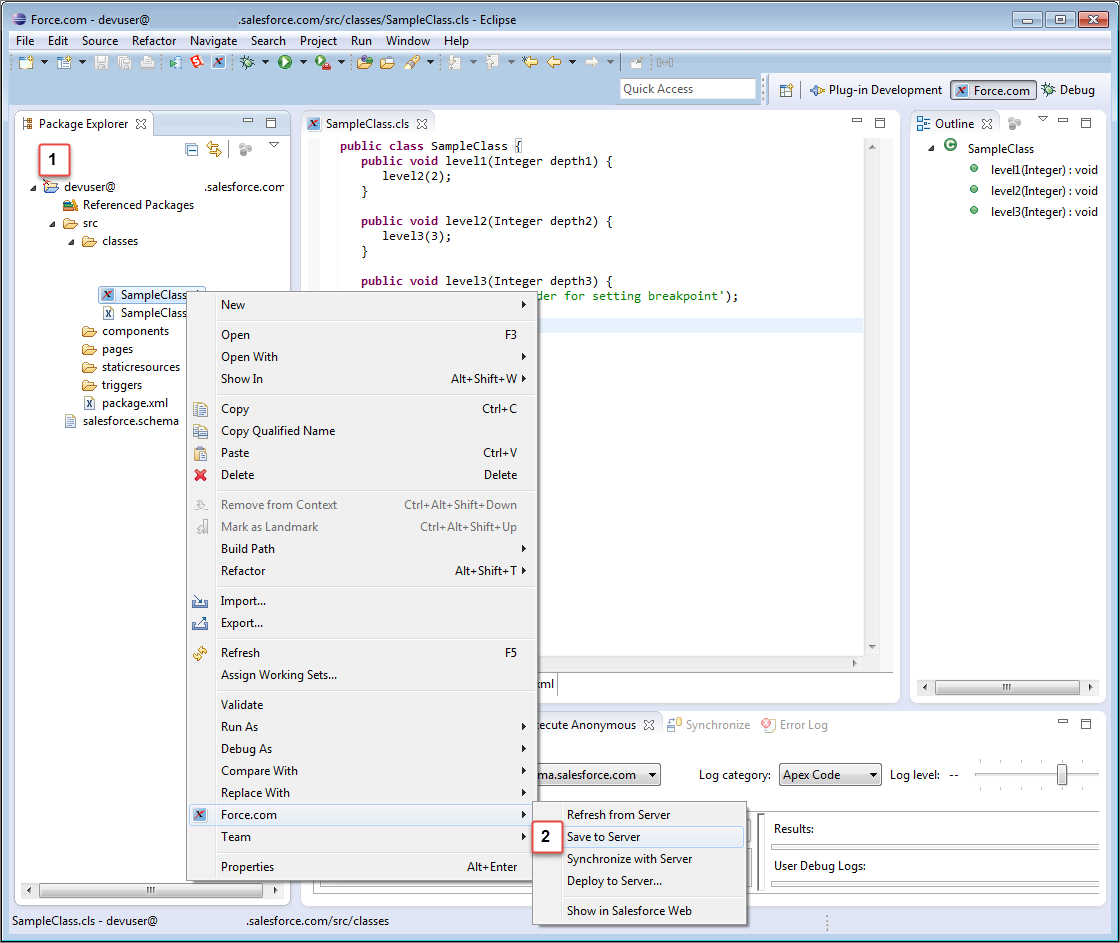
If you don’t have Work Online enabled, save the class to the server.
Right-click the class in the Package Explorer, then choose . This screenshot shows that Work Online is not enabled (1), and
demonstrates how to save to the server (2).
-
Switch to the Debug perspective by choosing .
-
Click the debug icon (
 ) in
the toolbar and select Debug Configurations.
) in
the toolbar and select Debug Configurations.
- Select Remote Apex Debugger.
-
To create a configuration for your project, click the New launch configuration
icon (
 ).
).
- Name the configuration.
- Click Browse and select your project.
- Click Apply, and then click Debug.
-
Click the debug icon () and
launch the new debug configuration.
-
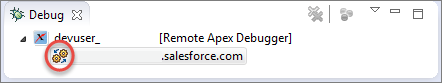
Wait until you see an icon showing turning yellow gears in the Debug
pane.
-
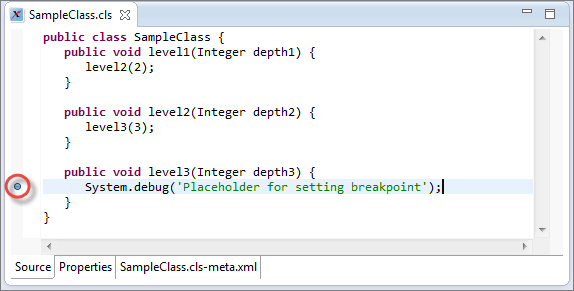
To set a breakpoint, double-click in the gray gutter to the left of the System.debug statement in
SampleClass.cls.
- Select the Execute Anonymous tab at the bottom of the screen. If the Execute Anonymous tab isn’t available, choose and add it.
- Make sure that your project is the Active Project.
-
In the Source to execute field, enter:
1new SampleClass().level1(1); -
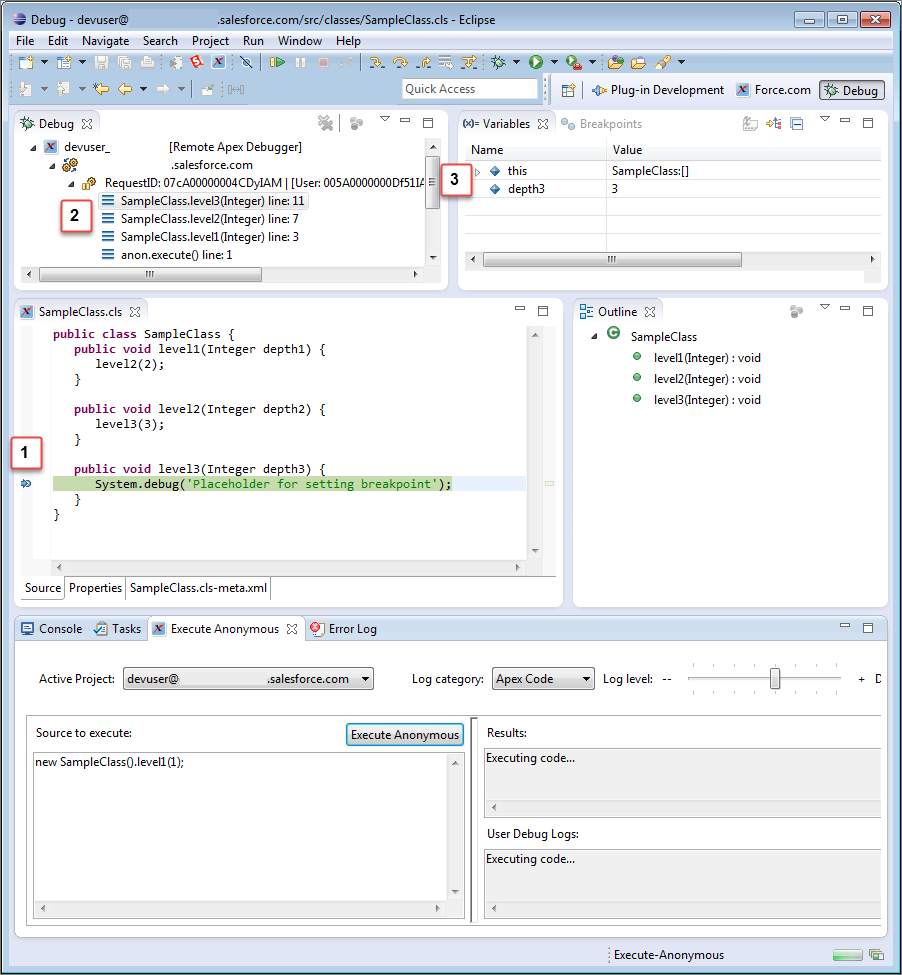
Click Execute Anonymous.
The Debugger stops at the breakpoint (1). The call stack (2) and the values of your variables (3) are displayed. When applicable, a URL showing how each request originated displays next to the request ID in your call stack details.