Analytics SAQL Reference
 j
jNewer Version Available
regr_r2()
field_y is a grouped dependent numeric expression and field_x is a grouped independent numeric expression. regr_r2(field_y, field_x) uses simple linear regression to calculate a trend line, then calculates R-squared. If the returned value is small, then functions like regr_slope() and regr_intercept() are likely to return accurate results.
The input fields (field_y, field_x) must contain at least two pairs of non-null values. This function works with simple grouped values but not with cogroups.
Example - How Well Does the Calculated Trend Line Fit My Data
Suppose that you have a dataset that includes the number of activities (such as meetings) and the won opportunity amount.
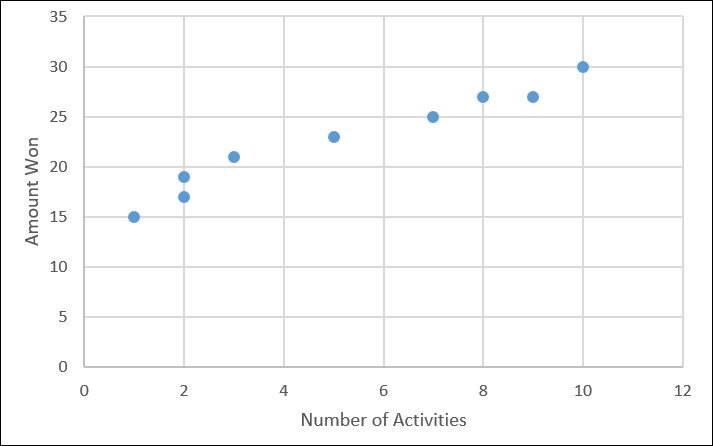
The value of R squared is 0.95.
