Lightning Communities Developer Guide
 j
jNewer Version Available
Analyze and Improve Community Performance
| Available in: Salesforce Classic (not available in all orgs) and Lightning Experience |
| Available in: Enterprise, Performance, Unlimited, and Developer Editions |
| User Permissions Needed | |
|---|---|
| To create, customize, or publish a community: | Create and Set Up Communities AND View Setup and Configuration |
To download the Community Page Optimizer, in Experience Builder, click  on the left sidebar and
click Advanced.
on the left sidebar and
click Advanced.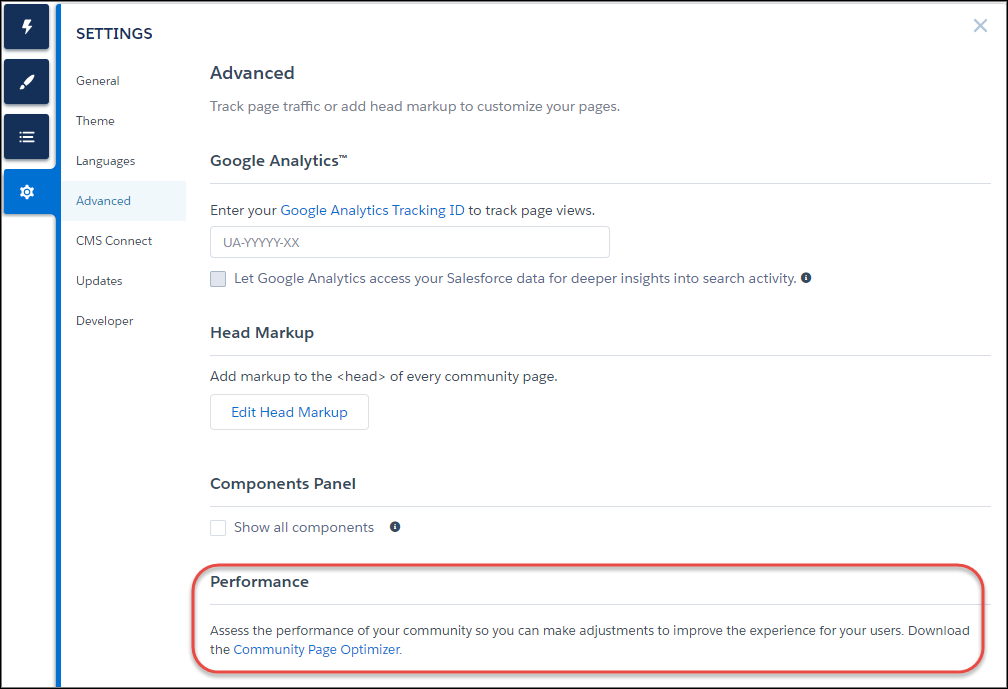
After installation, the Community Page Optimizer is located with your other Chrome
extensions. 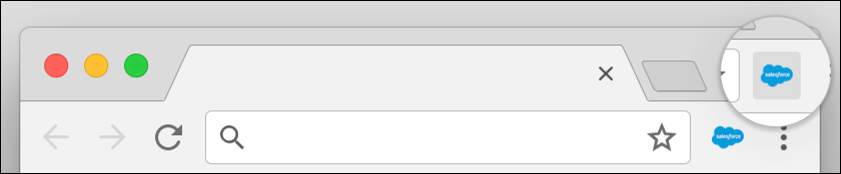
Insights
To analyze your community, navigate to your published community, load the page, and then
launch the Community Page Optimizer. 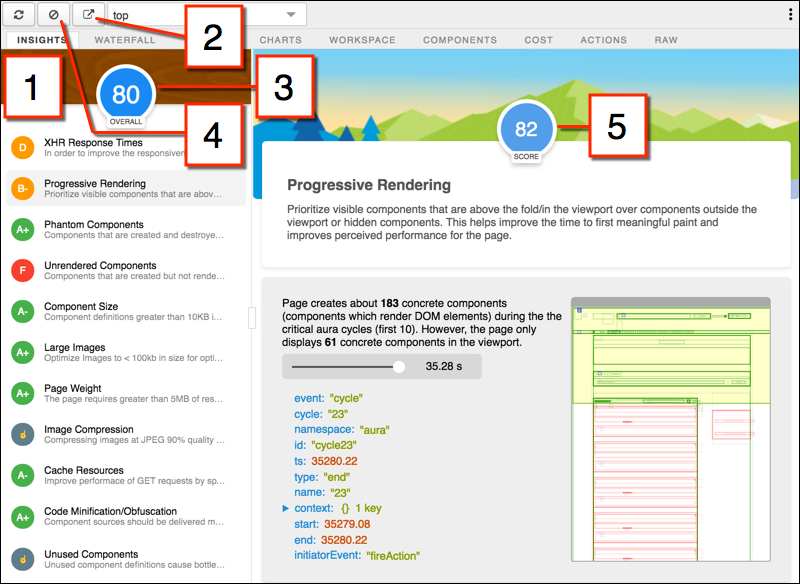
The Insights tab (1) evaluates your page based on best practices for web applications developed using the Lightning framework. This tab displays an overall performance score (3) along with individual scores (5) for various analysis rules. To view details and suggested actions, click each rule. Click Popout (2) for more room to work.
The Insights tab is conservative in providing recommendations. For further insights, consider reviewing the raw data presented on the Waterfall, Timeline, Charts, Cost, and Actions tabs.
Click Clear (4) to remove collected metrics. Perform some user actions on the page to collect new metrics and then reopen the Community Page Optimizer. For example, to gather performance metrics for liking a feed item, clear performance metrics, click Like, and reopen the Community Page Optimizer.
Waterfall
The Waterfall tab displays all network requests and performance instrumentation data. Click
a row to view contextual information in the sidebar. Click the arrow to the left of each row
to expand the information for each row. 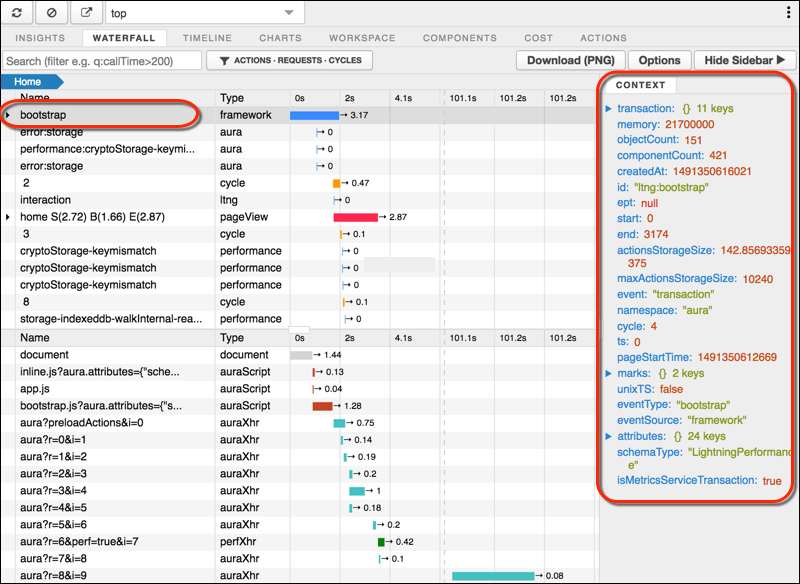
Timeline
The Timeline tab provides a profile of each component’s rendering life cycle. The timeline
view is optimized for displaying Lightning framework metrics, so it’s easier to interpret
than Chrome DevTools.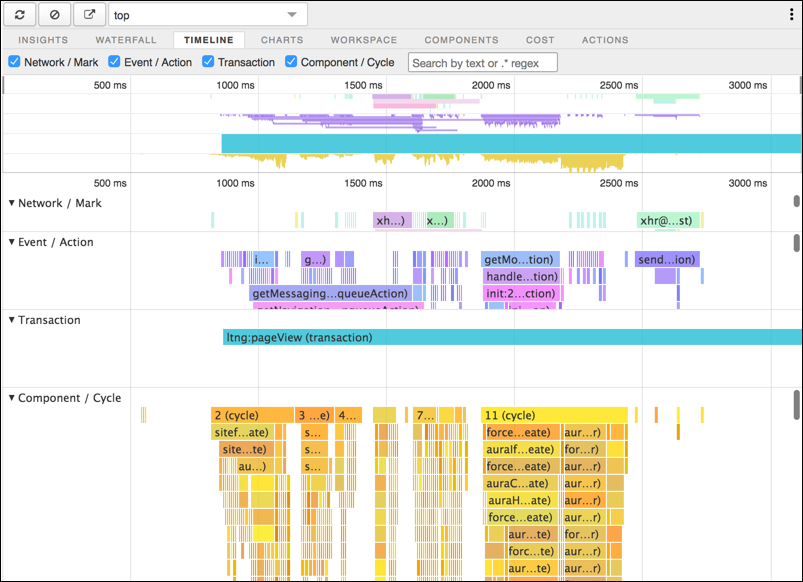
Charts
The Charts tab displays trending information about memory and components as customers use
your page.
Components
The Components tab displays the life cycle counts for each component on the page. This view
helps you identify potential component leaks and unexpected rendering behavior. Use the
Component tab along with the Cost tab for an overall view of component performance.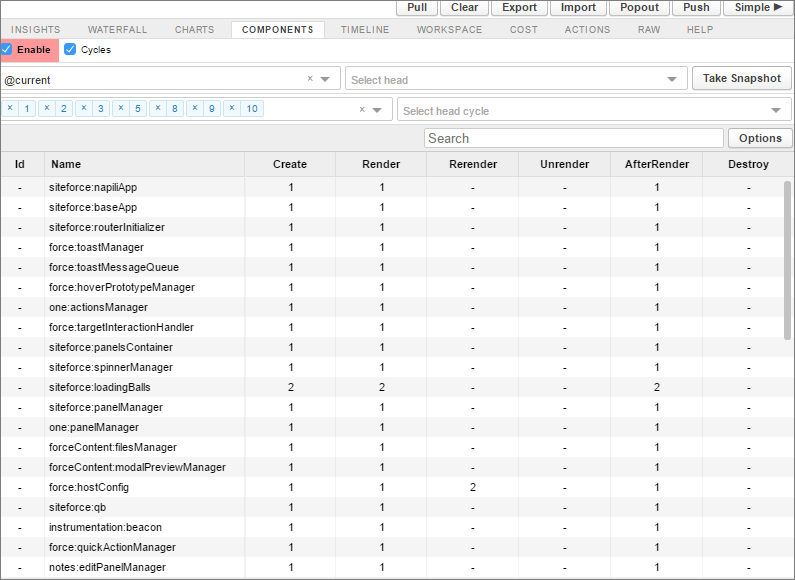
Cost
The Cost tab displays the amount of time each component was busy processing its logic. The
lower the time, the better the performance.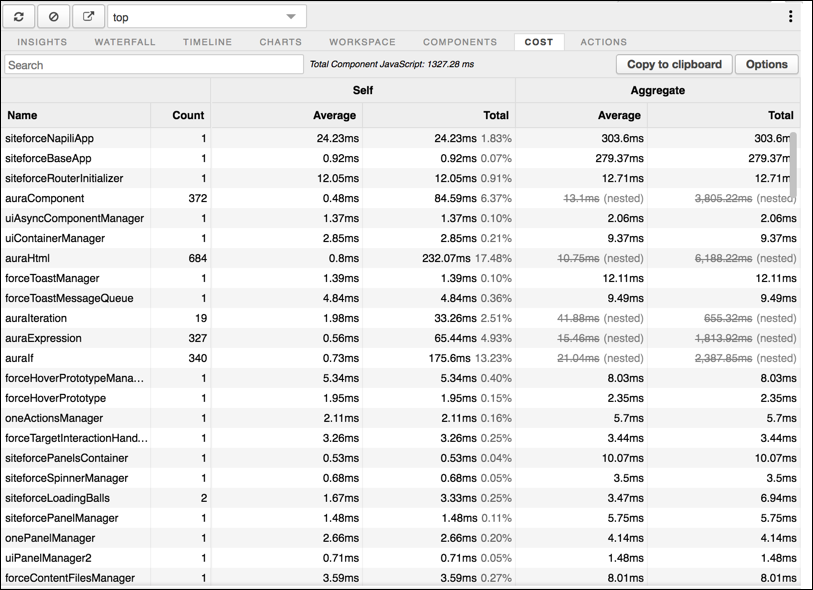
Actions
The Actions tab displays a list of all actions performed on the page, along with their timing information.
Export
Export your analysis to a file to share with your development and support teams. 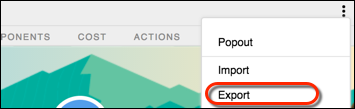
Submit Feedback
We want to hear from you. Share your comments, questions, requests, and any issues that you find. Submit Feedback.