ISVforce Guide
 j
jNewer Version Available
AMP Performance Timeline
See how your AppExchange Marketing Program (AMP) promotions contribute to listing
activity over time.
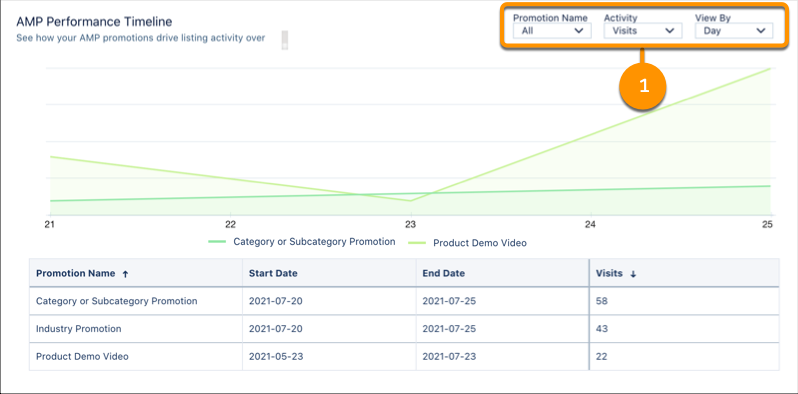
To change AMP promotions, activities, or time scale, adjust the local filters (1). The y-axis is resized based on the promotions and activities that you select. To resize the x-axis, change the View By filter. To see exact values, hover over a line in the chart.
If the visualization doesn’t display data, try filtering by different metrics, or change the time period. Data is available for AMP promotions from August 18, 2021 forward.
Definitions
Here’s how we define the metrics that appear in this
visualization.
| Metric | Description |
|---|---|
| Installs | Installs of your solution on AppExchange, your website, or from a code repository attributed to an AMP promotion. For AppExchange installs, we count the number of successful completions of the Get It Now installation flow. Includes installations in production and sandbox orgs. |
| Lead Events | Unique lead events attributed to an AMP promotion. Events include: demos, test drives, chat interactions, Learn More clicks, and Get It Now clicks or installs. A customer who clicks Get It Now and installs your solution is counted as a single lead event. |
| Visits | Visits to your listing attributed to an AMP promotion. Includes repeat visits by the customer. |
| Sponsored Tile Hovers | Hovers over your sponsored listing tile during home page, industry, or category promotions. To qualify as a hover, the customer must pause long enough over the tile to display the listing detail popover. Includes any repeat hovers by the customer. |
| Sponsored Tile Views | Views of your sponsored listing tile during home page, industry, or category promotions. To qualify as a view, the entire tile must be visible in the customer's browser. Includes any repeat views by the customer. |