Analytics SAQL Developer Guide
 j
jNewer Version Available
Analyze Your Data Over Time
Use SAQL date functions for advanced time-based analysis.
Example - on Which Weekday Do Customers Send the Most Emails?
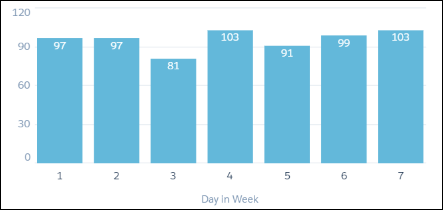
Suppose that you want to see which day of the week your customers are most active on email. This information allows you to better target your email campaigns. Use day_in_week() on the Mail_sent_sec_epoch field to calculate the day of the week, then count the number of records for each day.
1q = load "DTC_Opportunity_SAMPLE";
2q = foreach q generate day_in_week(toDate(’Mail_sent_sec_epoch’)) as 'Day in Week';
3q = group q by 'Day in Week';
4q = foreach q generate 'Day in Week', count() as 'count';
In this case, email traffic is slightly higher on day 4 (Wednesday) and day 7 (Sunday).