Analytics SAQL Developer Guide
 j
jNewer Version Available
Show the Top and Bottom Quartile
Use SAQL to calculate percentiles, like the top and bottom quartile of your
data.
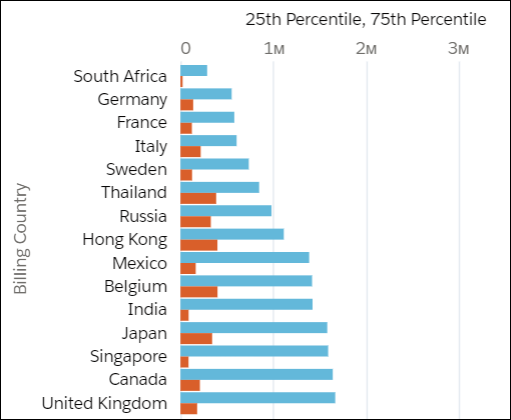
Example - Show Top Quartile and Bottom Quartile Deal Size by Country
Suppose that you want to see the top and bottom quartile deal size, by country. You want to see the size of the actual deal, not the interpolated (or 'average') deal size. Use percentile_disc(.25) and percentile_disc(.75).
Use a bar chart and select Axis Mode > Single Axis to show the top and bottom quartiles together.