ISVforce Guide
 j
jNewer Version Available
Filtering in AppExchange Marketplace Analytics
Global Filters
| Filter | Description |
|---|---|
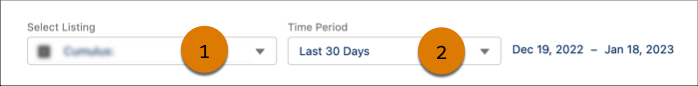
| Listing (1) | Select the AppExchange listing with data that you want to explore. You can view only your published listings. |
| Time Period (2) | Select a fixed time period for the data, or define custom start and end dates. |
Local Filters
| Filter | Description | Visualization |
|---|---|---|
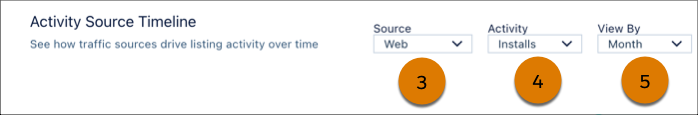
| Source (3) | Select traffic sources to show in the visualization. Traffic sources help you understand where an activity on your AppExchange listing originated, such as an AppExchange search or a Facebook ad. |
|
| Activity (4) | Select activity metrics to show in the visualization. An activity metric tells you how often an event or interaction occurred on your AppExchange listing. |
|
| View By (5) | Adjust the time scale of the visualization, such as days, weeks, months, or
quarters. Weeks are formatted as Wn, where n is a week number. For example, W1 represents the first week of the year. Likewise, quarters are formatted as Qn, where n is a quarter number. For example, Q4 represents the fourth quarter of the year. For both weeks and quarters, the year starts on January 1. |
|
| Lead Type | Select the types of lead events to show in the visualization, such as lead events from
demo views.
Marketplace Analytics categorizes lead events by listing activity starting on April 16, 2021. Before that date, we show only historical lead events. |
|
| Promotion Name | Select Partner Co-Marketing Program promotions to show in the visualization. |
|