Analytics SAQL Developer Guide
 j
jNote: This release is in preview. Features described here don’t become generally available until the latest general availability date that Salesforce announces for this release. Before then, and where features are noted as beta, pilot, or developer preview, we can’t guarantee general availability within any particular time frame or at all. Make your purchase decisions only on the basis of generally available products and features.
percentile_cont()
1percentile_cont(p) within group (order by expr [asc | desc])percentile_cont() accepts a numeric grouped expression expr and sorts it in the specified order. If order is not specified, the default order is ascending. It returns the value behind which (100*p)% of values in the group fall in the sorted order, ignoring null values.
p can be any real numeric value between 0 and 1. expr can be any identifier, such as 'xInt' or 'price', but cannot be a complex expression, such as price/100 or ceil(distance), or a literal, such as 2.5.
If expr contains no value that falls exactly at the 100*p-th percentile mark, percentile_cont() returns a value interpolated from the two closest values in expr.
For example, if Mea1 contains the values [0, 1, 2, 3, 4, 5, 6, 7, 8, 9, 10, 11, 12, 13] then:
1percentile_cont(0.25) within group (order by Mea1 asc) = 3.25
2percentile_cont(0.25) within group (order by Mea1 desc) = 9.75
3percentile_cont(0) within group (order by Mea1 asc) = 0
4percentile_cont(1) within group (order by Mea1 asc) = 13
Example - Display the Interpolated Value of the Bottom 15% of Deals
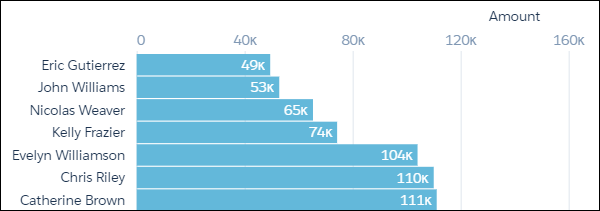
Suppose that you want to see the bottom 15% of deals for each rep. You don't need to see the actual deal size - just the 'average' size of the bottom 15%. Use percentile_cont(.15).