


Add Trace Flags and Log Levels
To generate debug logs in Web Console, you must add user-specific trace flags and log levels in the traceLogs.json file.
-
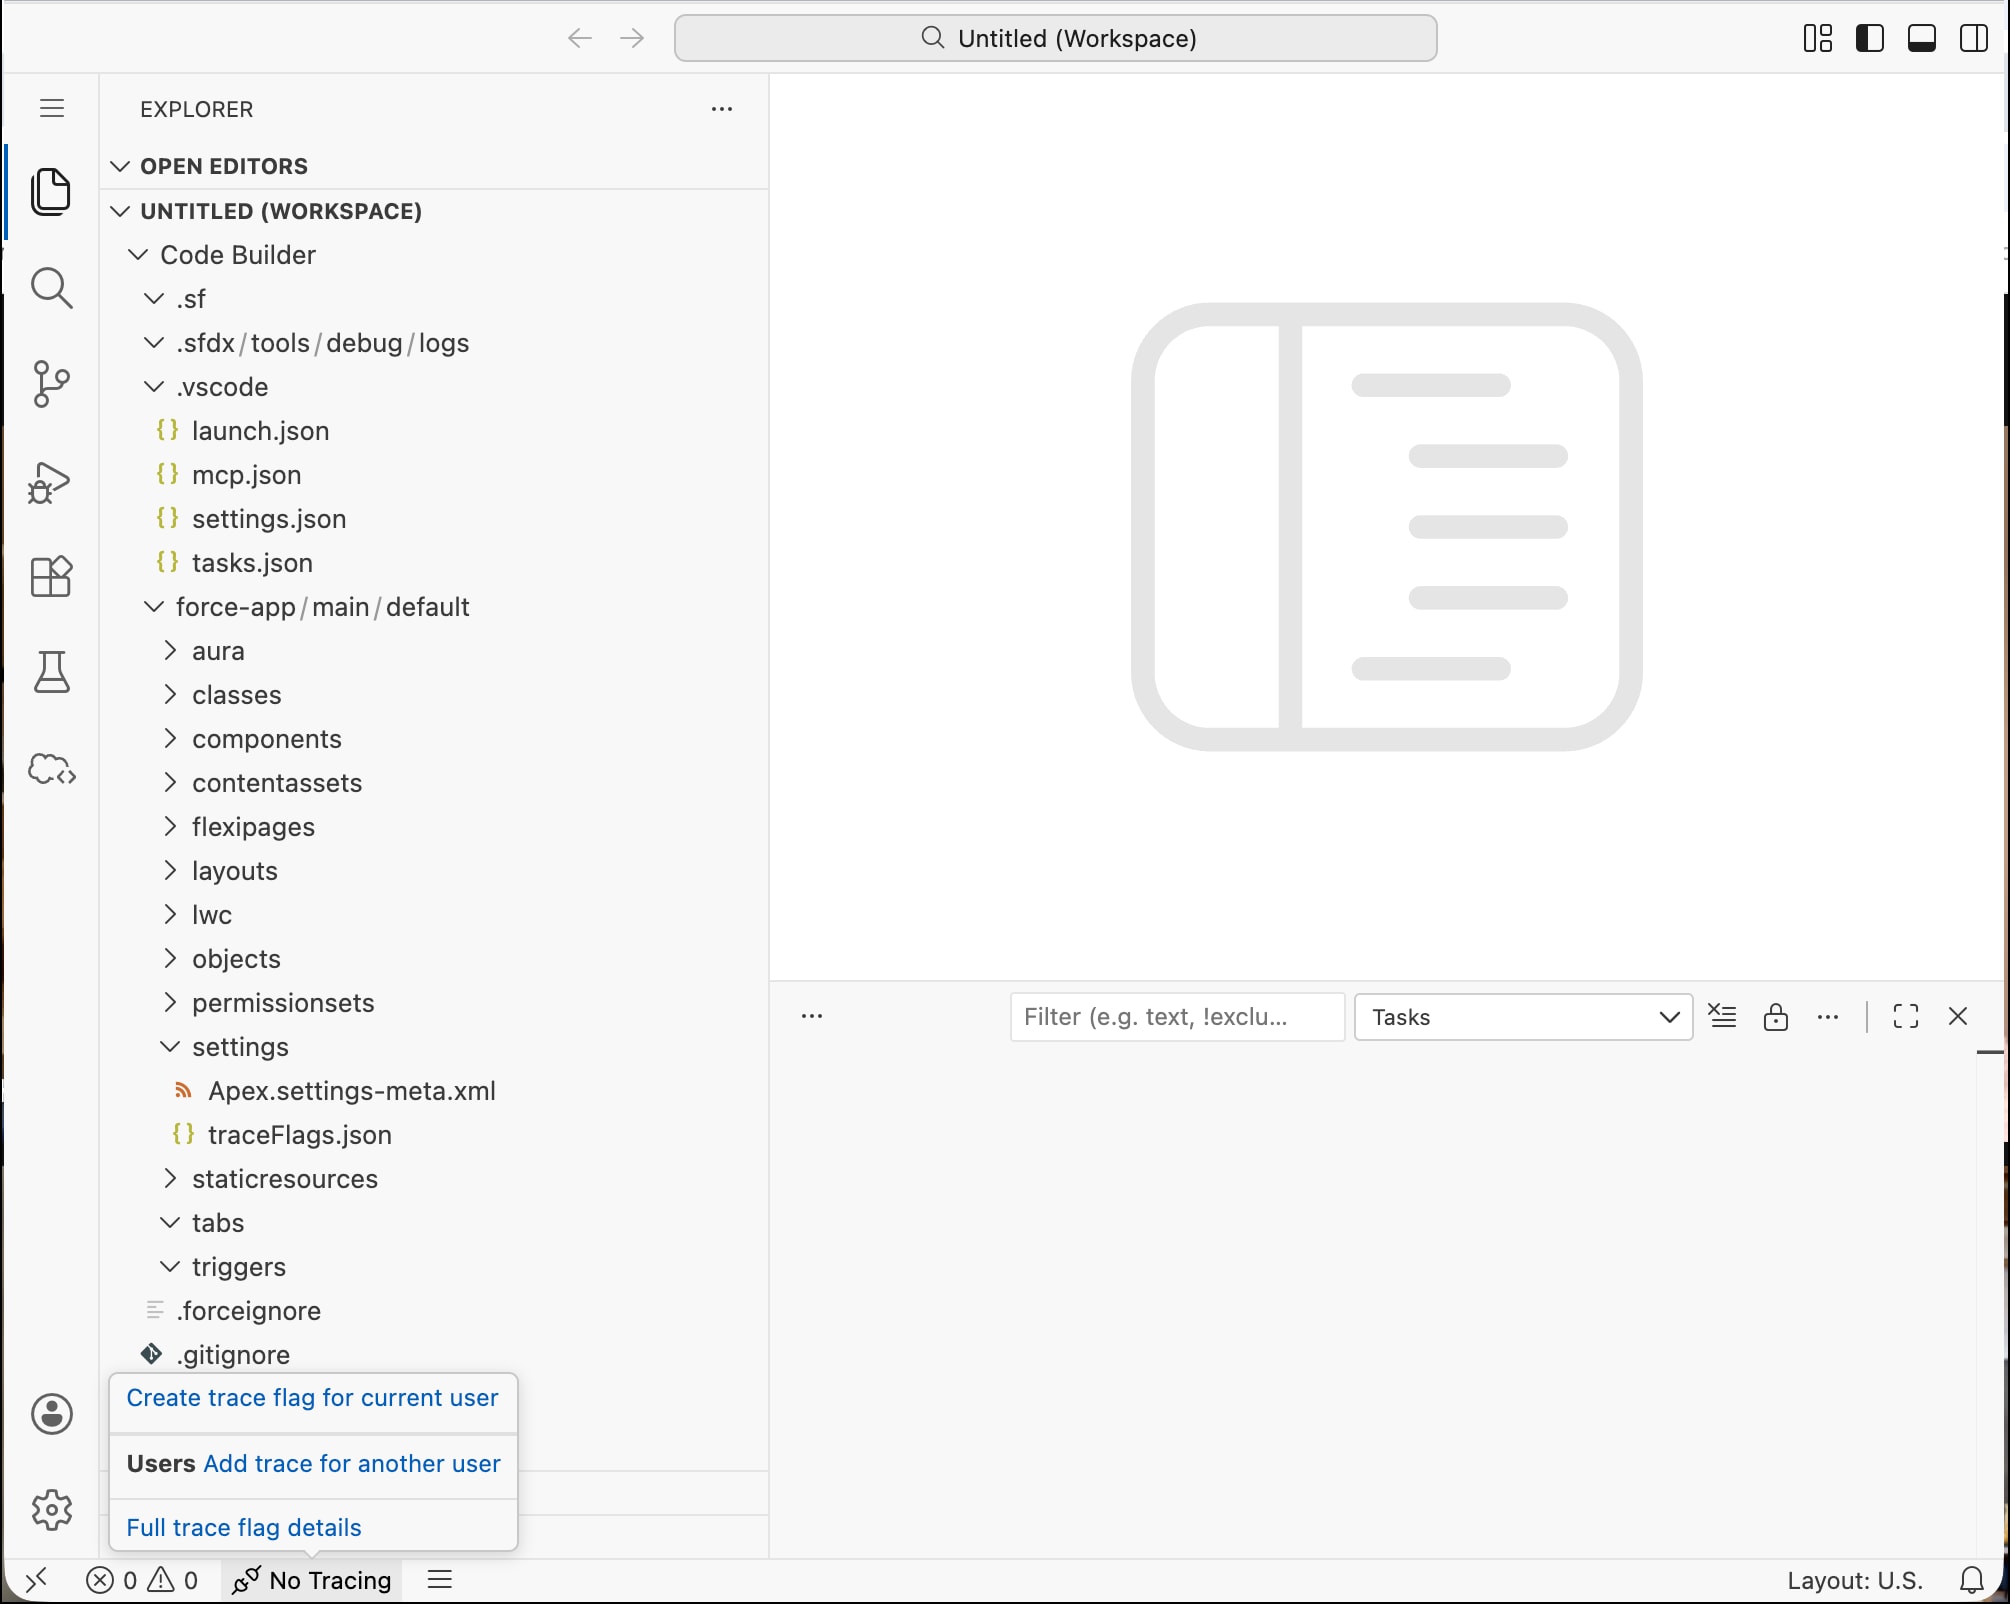
Hover over the No Tracing label on the task bar and select Create trace flags for the current user to add a trace flag for your user.
-
The
traceLogs.jsonfile opens with an added trace flag block for the current user. To change the log level for the current user, click the Change text before thedebugLevelNameproperty.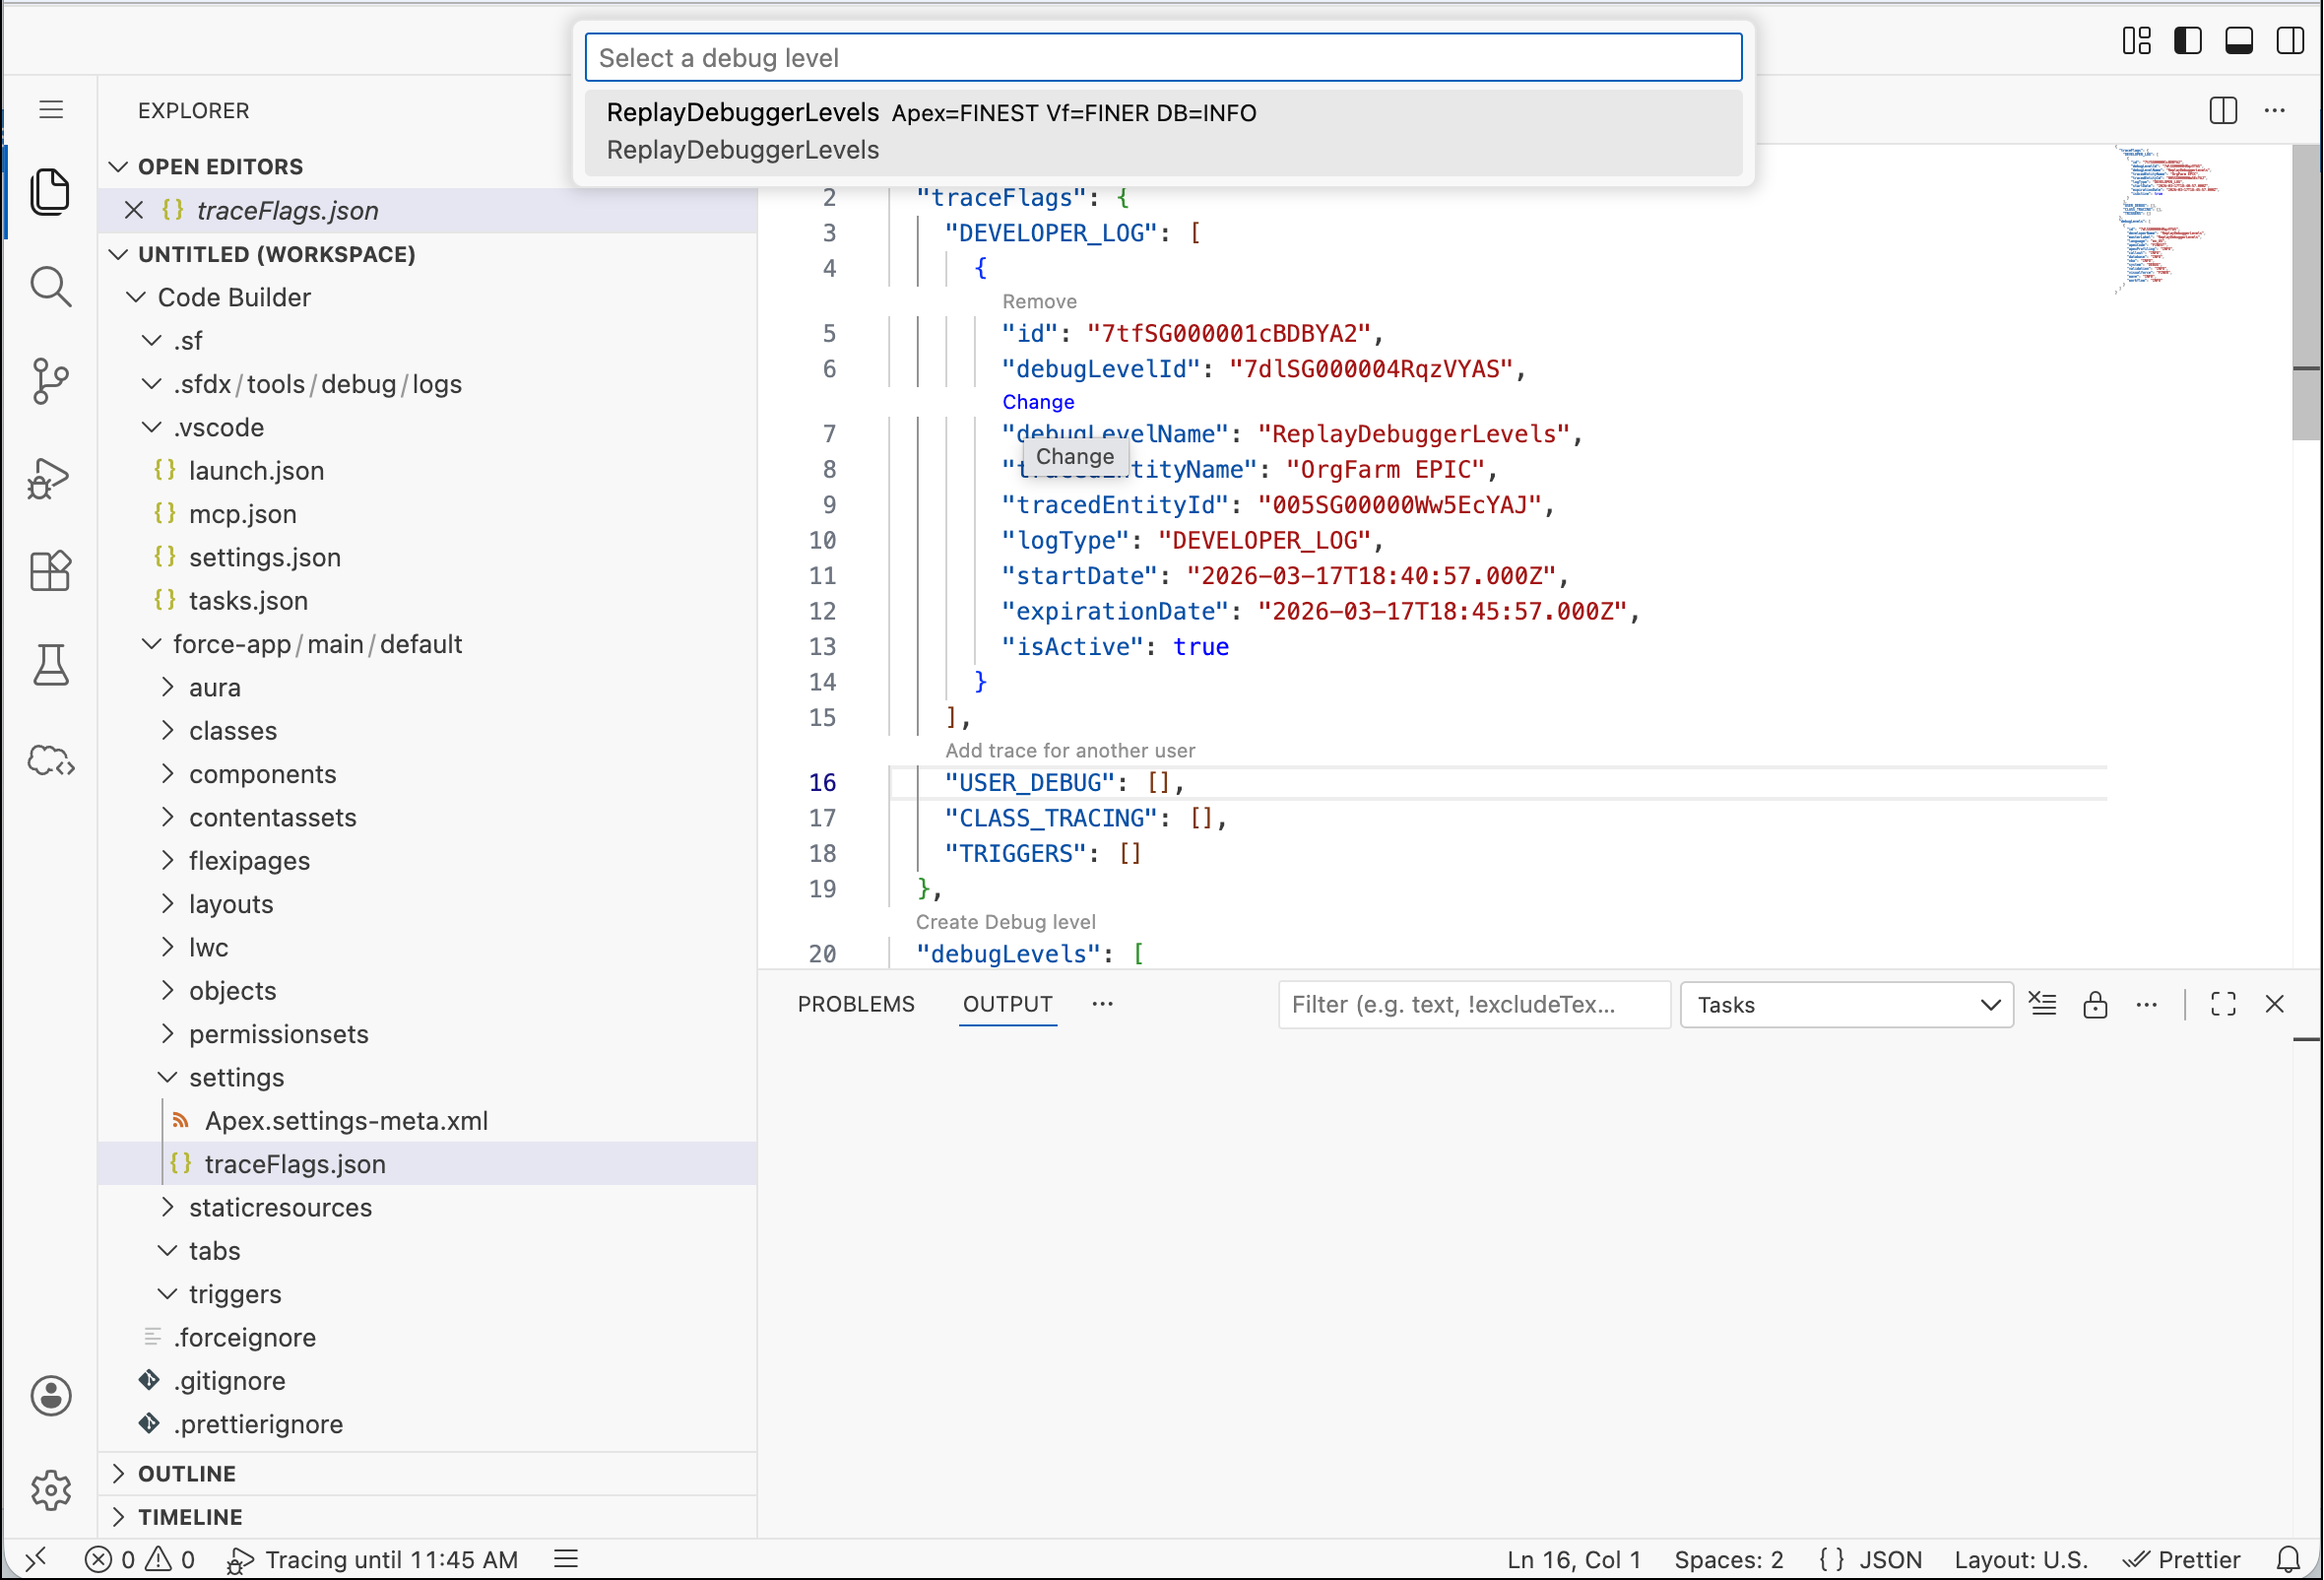
-
To add trace flags for another user, click the Add trace for another user text before the
USER_DEBUGproperty and specify a username to add. -
Add log levels.
For more information about log levels, refer to Debug Log Levels
Note
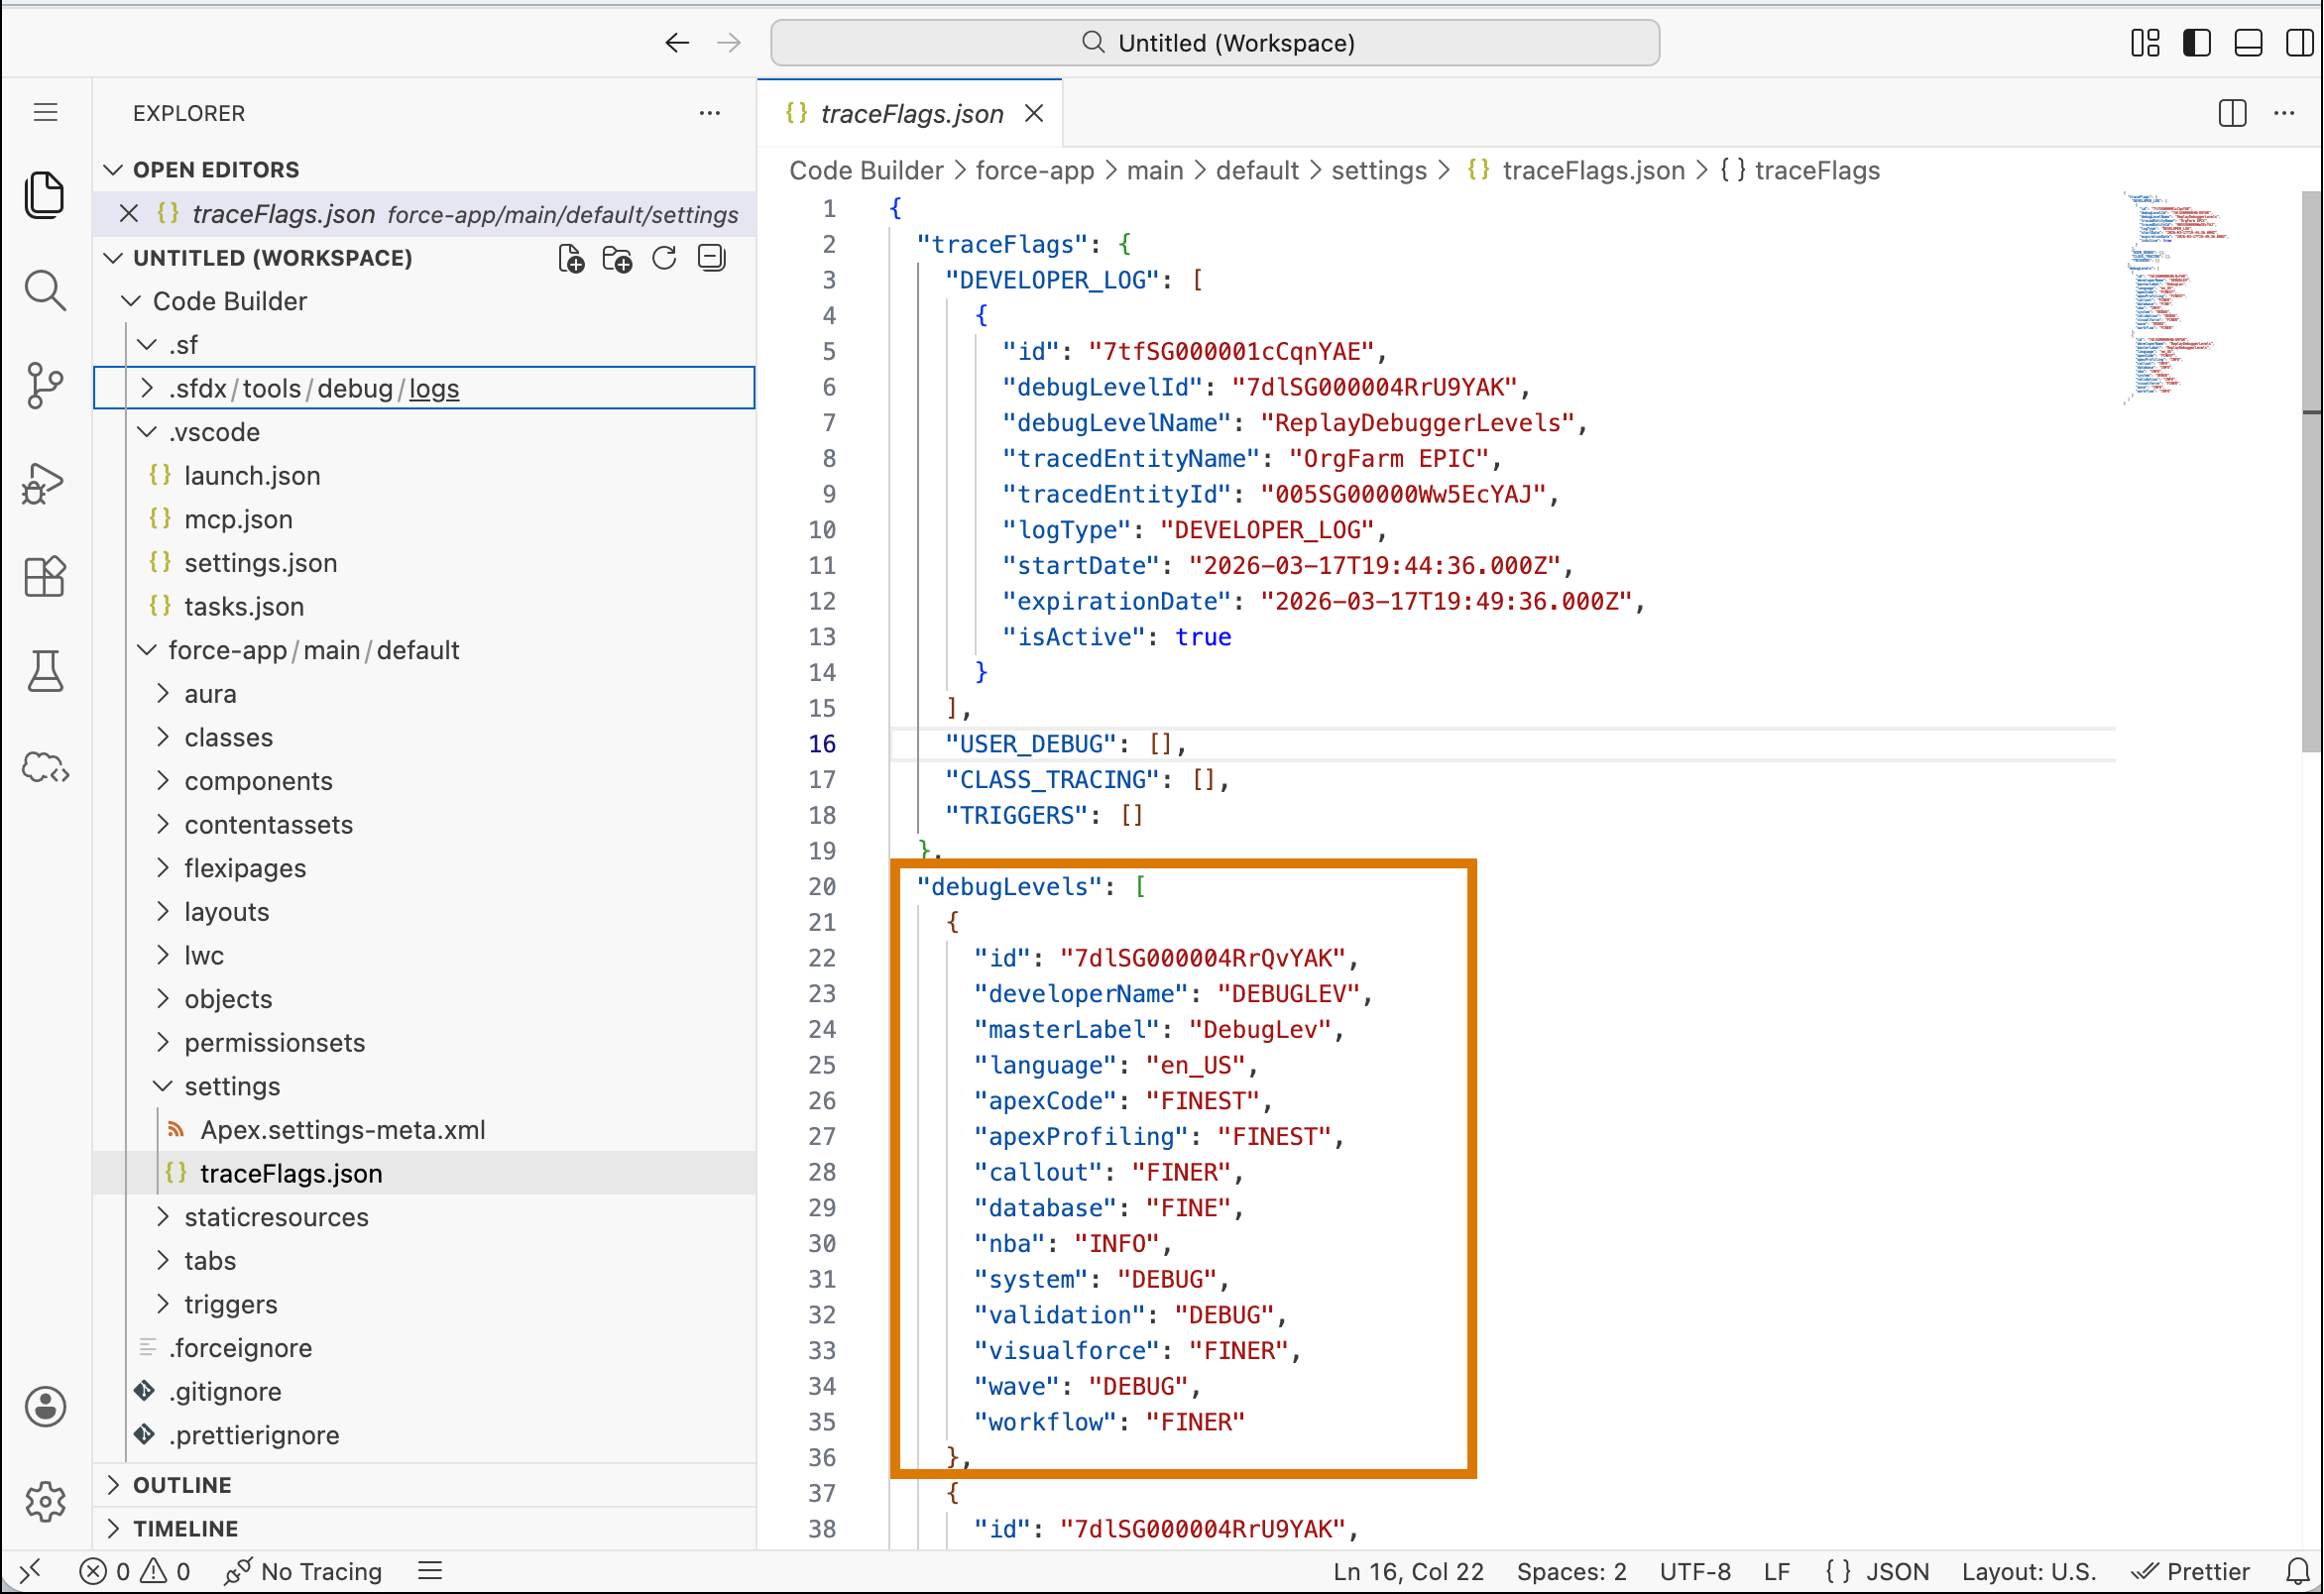
- Click the Create Debug level text.
- Type a label and press Enter.
- To accept the default log levels, select Yes. To customize log levels, select No and select an option for different log types.
-
To remove a block, click the Remove text before the block. Notice that the No Tracing label on the taskbar changes to Tracing until END-TIME.

After the tracing starts, whenever you perform a task on the connected org, a log is generated with trace details. Here’s an example.
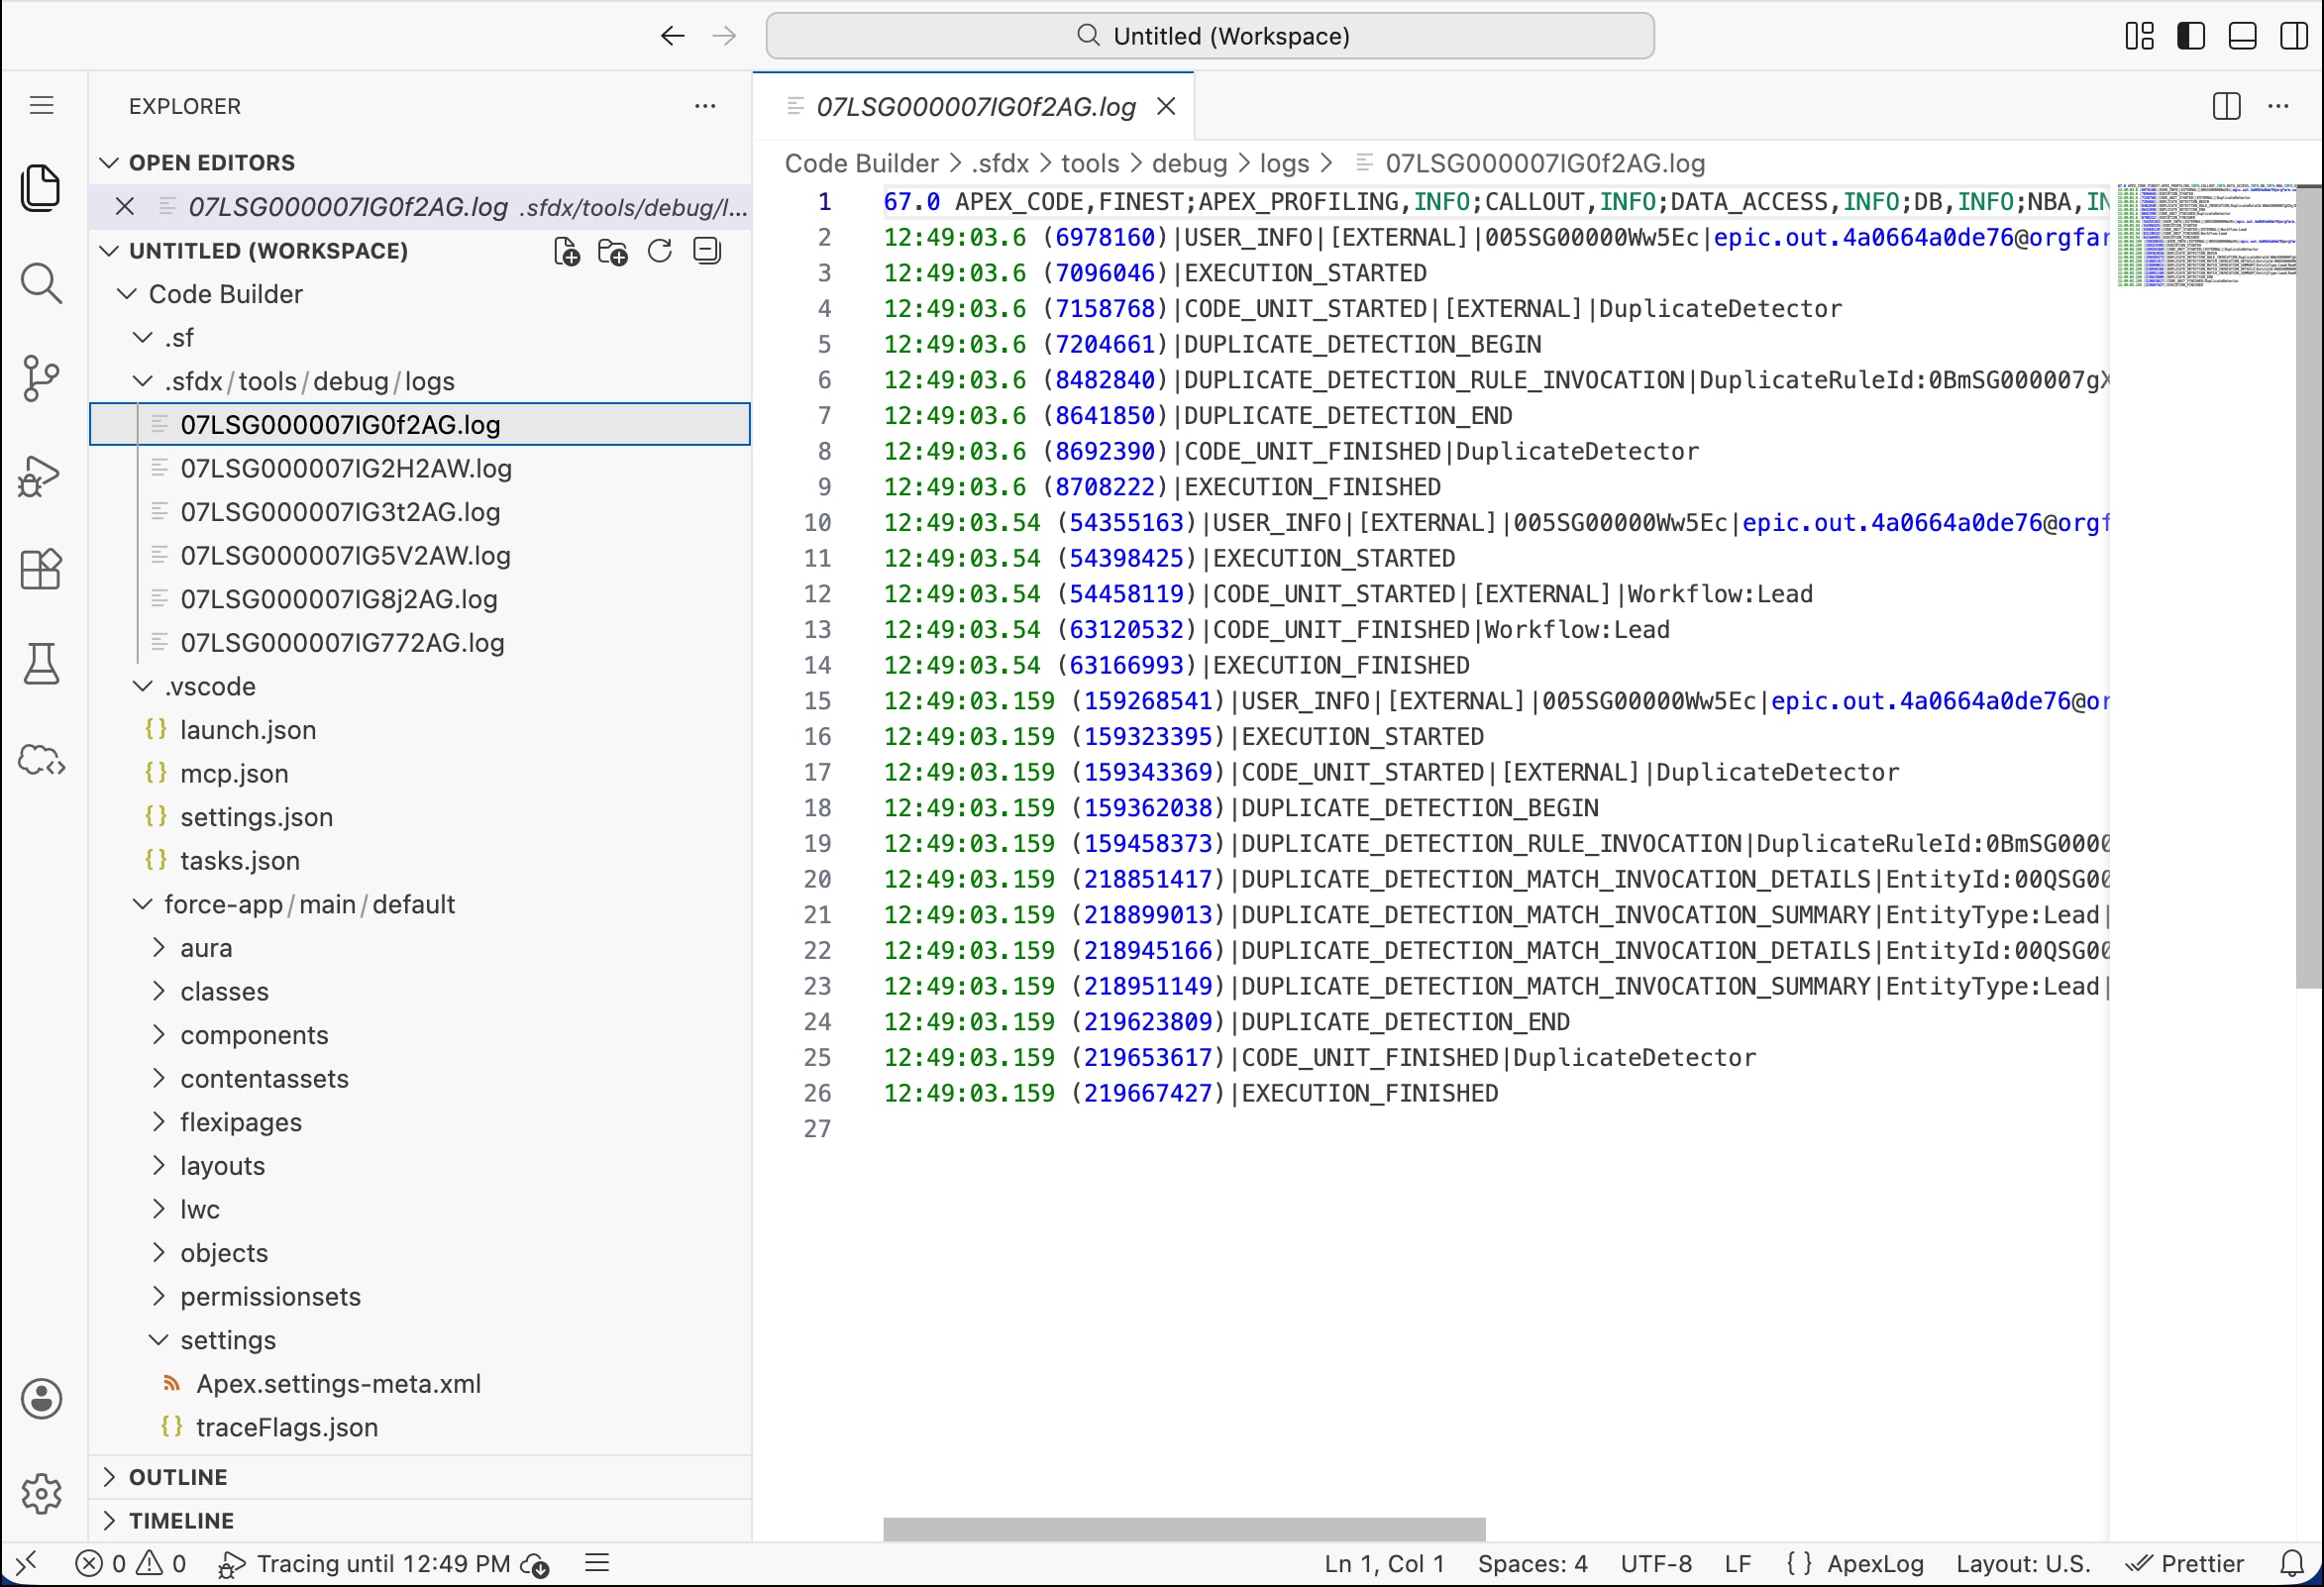
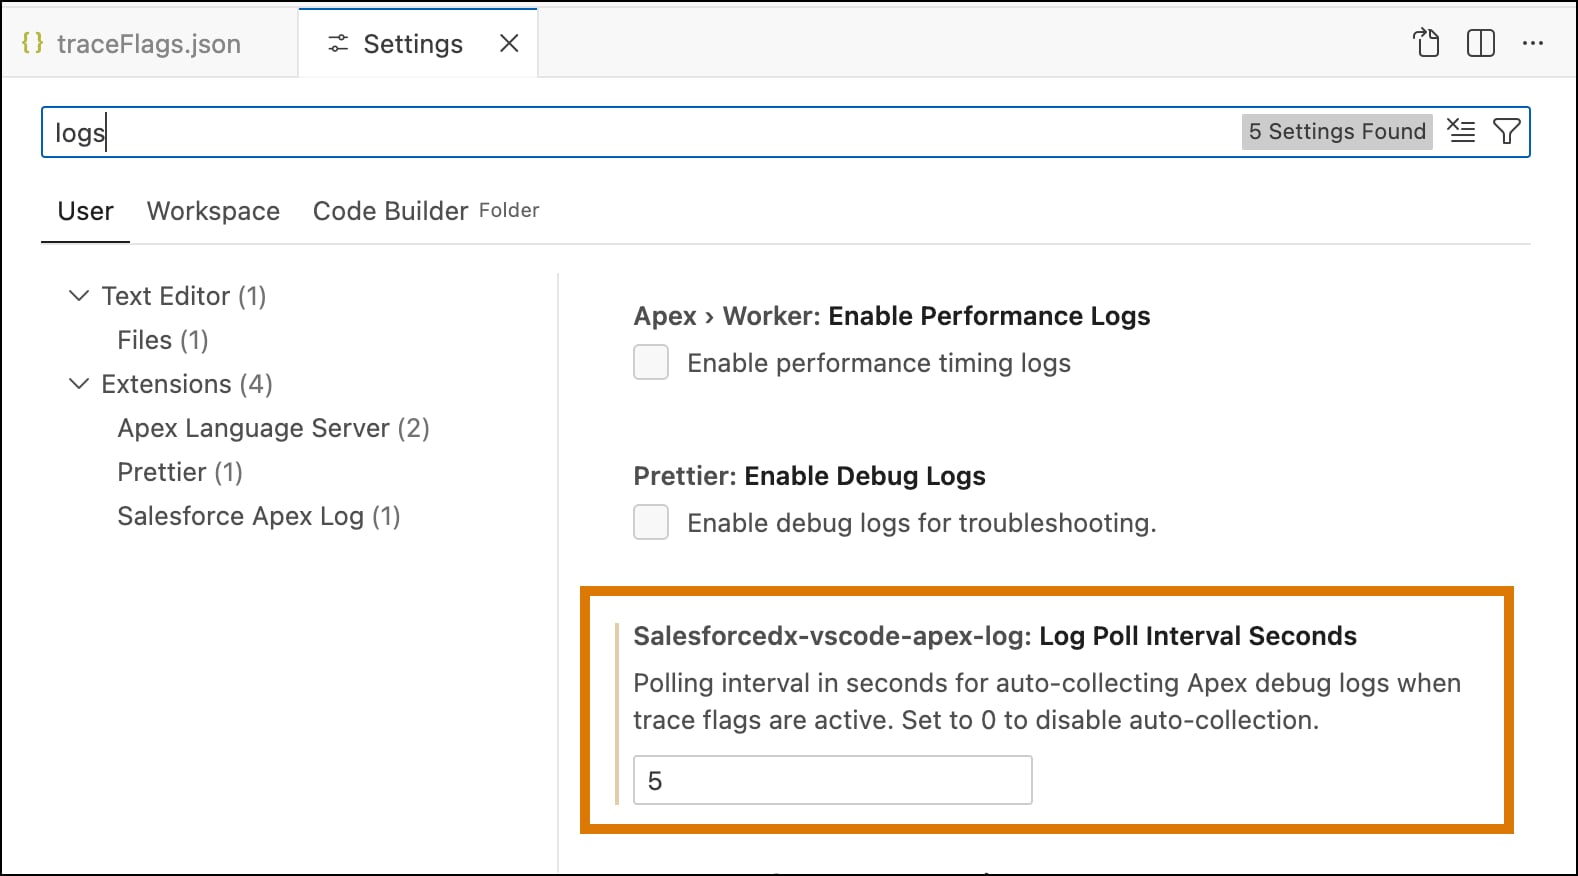
Logs are pulled by default after every 30 seconds. You can change the log-pull interval in Settings.
Beta Feature
 j
j