Imagine this scenario: you deploy a clean metadata migration on a Thursday night. All test suites pass. But by Monday afternoon, API execution times have doubled, database CPU utilization is pinning, and integration partners are flagging Service Level Agreement (SLA) breaches. The deployment clearly introduced a regression, but proving exactly what caused it typically triggers hours of manual correlation, digging through fragmented Event Monitoring logs, filing support cases, and cross-referencing deployment timestamps against ambient traffic spikes.
The good news is that there’s now a better way to troubleshoot such scenarios with Deployment Insights. This new feature in Scale Center automates post-release validation by unifying release events with platform metrics to deterministically isolate performance regressions from ambient traffic noise.
In this blog post, we’ll walk you through how this telemetry engine functions and how to integrate it into your deployment runbooks to proactively catch stability issues before they impact your SLAs.
The post-deployment blind spot
Upon initiating a metadata deployment within a high-scale environment, conventional observability frameworks often struggle to address three critical architectural challenges:
- Fragmented telemetry correlation: Validating systemic health demands intensive manual effort to bridge siloed metrics, where end user EPT, application server cycles, and Apex resource exhaustion signals remain isolated across disparate logs.
- The deterministic baseline challenge: Quantifying release-driven degradation requires comparing post-deployment performance against an equivalent peak-load window. Identifying a historical interval that precisely mirrors current traffic volume and utilization patterns is historically tedious and prone to error.
- Latent architectural regressions: Inefficiencies, such as a non-selective query embedded in new trigger logic, frequently escape detection in staging. These silent performance shifts only surface as critical bottlenecks when production traffic reaches peak utilization.
Deployment Insights eliminates this operational blind spot by unifying release events with Scale Center’s automated telemetry engine, delivering deterministic comparisons to identify exactly how code modifications impact environment stability.
Navigation and interpretation of the Deployment Insight Report
To generate a Deployment Insights Report, follow the steps below.
- Navigate to the Setup Menu in Scale Center.
- Go to the Deployment Insights section.
- Select a specific deployment.
- Click the Generate Insights Report button to view the report for that deployment.
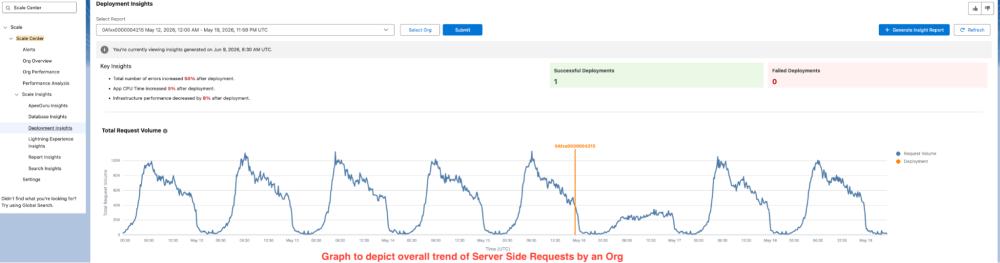
Once generated, the report moves from high-level operational signals down to granular, actionable component details.
Delta analysis and top-line telemetry
The top of the report delivers an automated delta summary, highlighting immediate efficiency shifts. Instead of looking at raw numbers, it provides percentage-based variances for foundational enterprise metrics. Sections include:
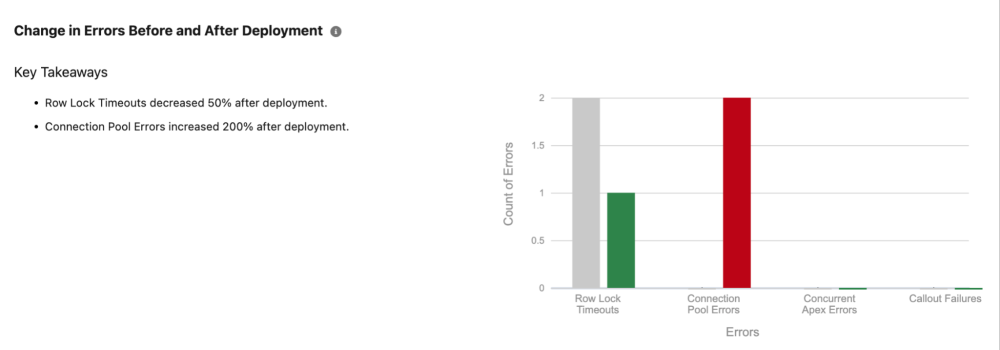
- Change in Errors Before and After Deployment
- This section provides visualization for the anomaly in the errors related to Rowlock timeouts, such as concurrent errors, connection pool errors, or callouts, that may have started to increase or decrease post deployment
- Change in Performance Before and After Deployment
- Average SOAP and REST API Request Time: This metric provides degradation in the performance of the REST API and SOAP API-based requests getting invoked from external integration syncs
- App CPU vs. DB CPU Per Request: This metric instantly reveals if your application custom code has started to use more application server cycles (e.g., massive loops, inefficient JSON parsing) or stalling on database execution (e.g., non-selective queries post deployment
- User Experience (EPT): This metric surfaces the overall experience from the response time of UI-based requests that matters most to the end user experience
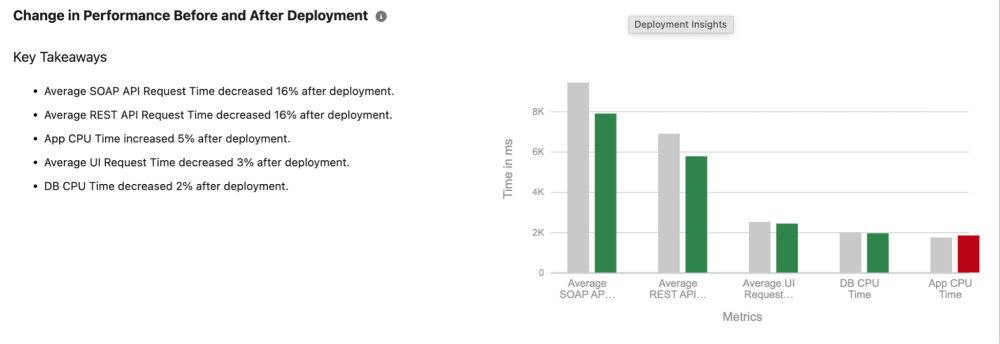
Each section provides self-explanatory takeaways for interpretation. The goal here is to provide a unified view of the data, so it’s easier to quickly identify whether or not a release deployment has actually created an issue in the first place.
Specialized diagnostic deep-dives
The Deployment Insights Report doesn’t stop at highlighting whether or not there was a problem, but it also identifies where the problem started post deployment and what actions can be taken up by the users to remediate those errors.
Beneath the top-line metrics are four dedicated tabs built for rapid, targeted triage: Errors, User Experience, API Performance, and Infrastructure Performance.
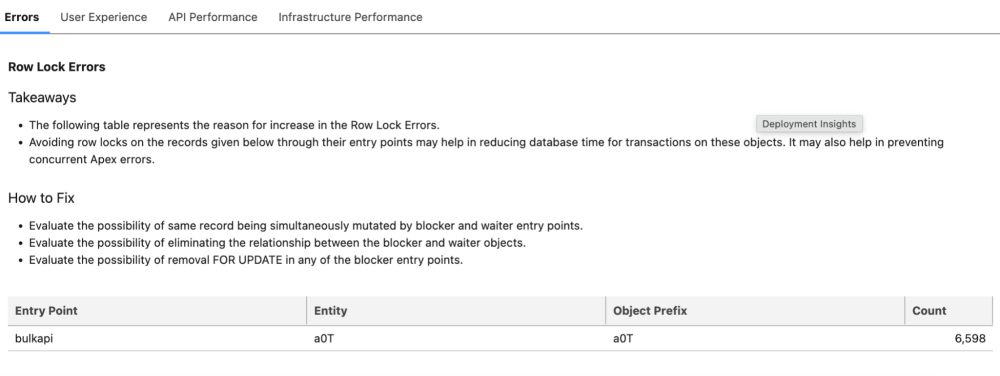
To identify a regression in any of the metrics shown, click on the checkbox Display numerical change from before to after deployment present in each of the tabular data.
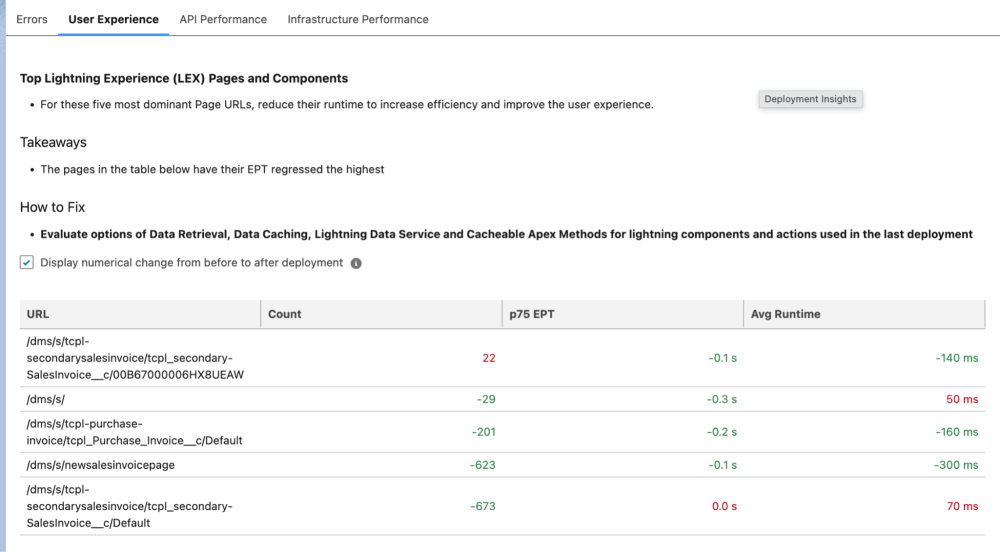
Here is the tabular representation of each of these sections and the data that it provides for remediation. For each section, it clearly outlines the recommended fix on the entry point.
| Diagnostic Tab | Engineering Focus | Concrete Actionable Output |
| Errors | Concurrency and platform friction | Identifies Row Lock Errors and Concurrent Apex Limits, and maps raw database entities back to human-readable object names. |
| User Experience | Client-side performance | Provides p75 of page load times for specific page URLs, and highlights exactly which layouts or components regressed. This value represents the 75th percentile for EPT, which means that 75% of page loads for your users were this fast or faster. We use p75 instead of the average (or 50th percentile) because it more accurately represents the experience of users who encounter slower performance. This metric helps you to identify and focus on issues that affect a significant portion of your user base. |
| API Performance | Integration layer integrity | Segregates REST vs. SOAP health, isolating long-running executions (over five seconds) to catch regression trends before they trigger external gateway timeouts. |
| Infrastructure | System resource consumption | Pinpoints the dominant entry points (e.g., specific triggers, integration users, or batch jobs) contributing most heavily to App or DB CPU spikes. |
Under the hood: The telemetry engine architecture
Lets now understand the details of how we built the Deployment Insights Telemetry system.
The system doesn’t just display linear historical trends; it builds a deterministic comparison model. The platform operates on an asynchronous pipeline that balances the Scale Center UI with backend system-level services to compute performance deltas without adding any runtime overhead to your production instance.
Here is how the system orchestrates this process behind the scenes:
Deployment Telemetry Processing Flow
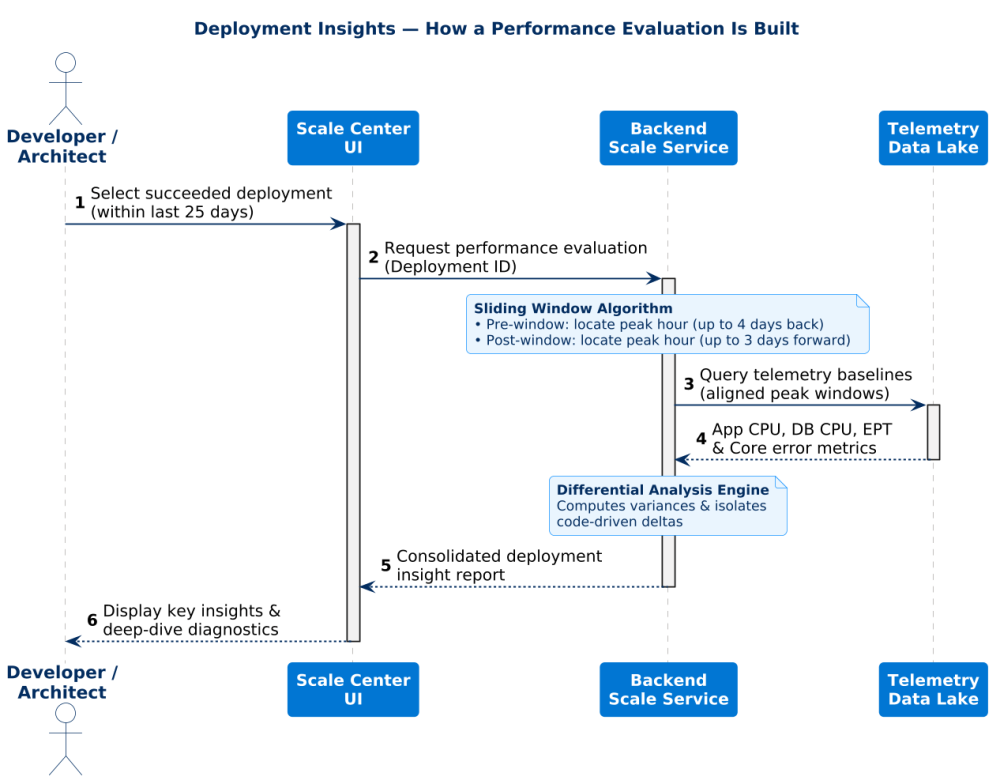
Behind the scenes, the telemetry engine orchestrates a coordinated, four-step lifecycle to deliver deterministic performance insights:
- Deployment Identification: The engine catalogs metadata and managed-package events from a 25-day rolling window, establishing a comprehensive chronology of environment modifications.
- Sliding Window Calculation: Upon report initiation, a backend heuristic scrutinizes historical load patterns. It performs a four-day retrospective to establish a pre-deployment peak hour baseline, aligning it against a verified post-deployment peak traffic hour derived from up to a three-day forward-looking analysis.
- Telemetry Aggregation & Normalization: The system harvests high-fidelity metrics from across the infrastructure layers, specifically isolating fluctuations in app CPU, database execution, EPT, and platform concurrency limits.
- Signal Isolation: By correlating synchronized high-utilization windows, the engine filters out ambient traffic noise to spotlight architectural regressions driven solely by code changes.
Architect’s tip: The Peak Hour Principle
Modern enterprise architectures are notoriously complex, generating vast oceans of telemetry. Effective validation requires analyzing performance during high-stakes business windows, where peak system load intersects with critical server-side behaviors. To address this, the engine intelligently identifies these specific peak hours, automating performance comparisons across high-utilization intervals to distinguish genuine production regressions from an optimized baseline.
System requirements, considerations, and noise isolation
To get the most out of Deployment Insights, architects must keep a few system behaviors and boundary conditions in mind:
- Supported deployment types: The engine can track metadata changes across all standard delivery mechanisms, whether your pipeline pushes changes programmatically (via the Salesforce CLI or direct Metadata API calls), promotes work items through DevOps Center, uses native change sets, or installs unlocked packages.
- Minimum traffic thresholds: Because the engine relies on the Peak Hour Principle, the target organization must maintain a baseline of active production traffic. In ultra-low volume orgs’ full copy sandboxes with sporadic usage, the sliding window heuristic may struggle to isolate clear peak-hour baselines.
- Isolating environmental noise: If multiple decoupled teams deploy changes within the same deployment window, or if a seasonal traffic surge (like a scheduled marketing blast) occurs simultaneously, results can become ambiguous. In these scenarios, use the Infrastructure tab to isolate the specific entry points. If the DB CPU spike correlates to a specific Apex class modified in your deployment payload, it is a code regression. If the spike is uniformly distributed across unchanged legacy APIs, the shift is likely environmental noise.
Post-deployment runbook best practices
To shift your release cycle from reactive firefighting to automated validation, incorporate Deployment Insights directly into your production deployment runbooks using this checklist:
- Establish a mandatory release gate: Add a Deployment Insights review as a standard checklist item for your deployment team, treating post-release performance validation with the same severity as your automated test runs.
- Enforce the 24-Hour stabilization window: Do not generate the report immediately after a deployment finishes. Allow the production environment to run for 24 hours, so the telemetry engine can capture a true, representative peak-load business window.
- Analyze percentage-based deltas: Generate the report and scan for color-coded deltas. Focus on any core metric (App CPU, DB CPU, or EPT) that exhibits a regression greater than 15% from the pre-deployment baseline.
- Bypass manual log triage: If a regression is flagged, skip manually writing Event Log File queries. Use the report’s integrated diagnostic deep-links to pivot directly into a specialized investigation view (such as a Concurrent Apex Investigation), which will automatically load with the exact peak-hour timestamps pre-populated.
About the author
Anand Vardhan is a Product Owner for the Scalability Products Team, helping customers develop scalable solutions on the Customer 360 platform. Anand designs features for Scale Center and Scale Test products. His background includes performance and scale engineering, server-side optimization, Lightning, application design, caching, and managing large data volumes. Follow Anand on LinkedIn.
Ravi Raina is Director Product Management at Salesforce working on the Scalability Products portfolio.