


Other Widgets
The Hello World example is a simplified scenario. The most common real world use cases are a custom data visualization, a selection widget, or even better, a widget that does both. With practice, you can add anything you want. To see a list, a third-party data visualization integration, a hierarchy, and more widgets, check out the example GitHub repository.
GitHub Examples
Clone the GitHub example repository, git clone https://github.com/forcedotcom/sfdx-analytics.git. Open the repository in Visual Studio. The Lightning Web Component examples are in the quick-start/main/default/lwc directory and include:
| Example | Description | Requirements |
|---|---|---|
breadcrumb | Leaves breadcrumbs as users navigate through a dashboard. | No step or attribute requirements |
graph | Render a graph. | Requires 2 attributes from step results:
|
hierarchy | Render results into a hierarchical structure as a tree grid. | Requires 4 attributes from step results:
|
libsChartjs | Render results using Chart.js. | Requires 2 attributes from step results:
|
list | Render results in a list. | Requires a step, but no attributes. Set up the component with a simple step of Count of Rows on 1 field and it lists the field results. |
playButton | Play recording of dashboard selection changes. | Requires a step and 1 attribute.
|
selectNavigate | Navigate to another dashboard page. | Requires a step and 1 attribute.
|
tdxGanttChart | Gantt chart example with multiple attributes exposed for user input in a CRM Analytics dashboard. | Requires 4 attributes from step results, plus formatting attributes:
|
wordcloud2 | Render a word cloud. | Requires 2 attributes from step results, plus formatting attributes:
|
Using the Hierarchy Component
To test and play with this component, create a custom static query in the dashboard editor.
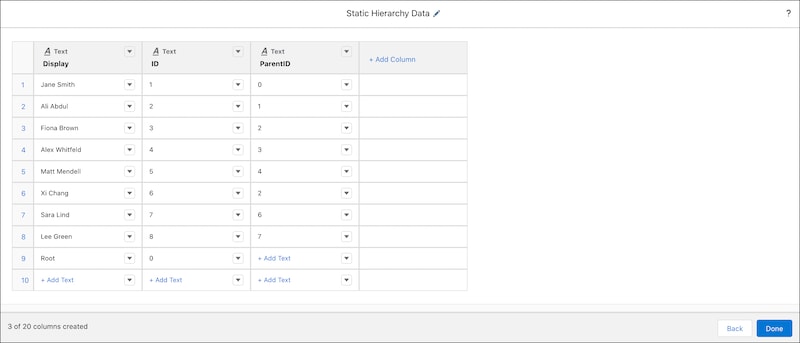
Drop a component on the dashboard, select Hierarchy from the Lightning Components list, and use Existing Query to set the custom static query as the component step.
In the component properties menu, set the Component Attributes to these values.
- ID Column - ID
- Parent ID Column - ParentID
- Label Column - Display
- Root Node - 0
Save your work and preview the dashboard to see the working hierarchy component. If you make any updates to the component attributes, refresh the dashboard in preview mode to render the changes.
Using the TDX Gantt Chart Demo Component
To test and play with this component, create a custom query in the dashboard editor. Use the Opportunities dataset to create a values table query with six columns. The six columns are CreatedDate, CloseDate, Opportunity Name, Opportunity Owner, Amount, and Stage.
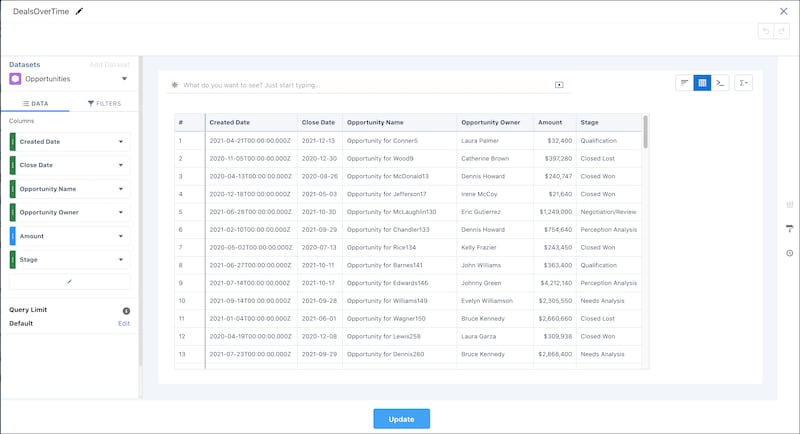
Drop a component on the dashboard, select TDX Gantt Chart Demo from the Lightning Components list, and use Existing Query to set the custom query as the component step.
In the component properties menu, set the Component Attributes to these values.
- From Column - CreatedDate
- To Column - CloseDate
- Label Column - Opportunity Name
- Color Column - Stage
- Axes Type - time
- Title - Deals over Time
- Title Font Size - 22
- Subtitle - Dealflow Analysis
- Subtitle Font Size - 11
- Theme - Sunrise
- Background Color - #FFFFFF
Save your work and preview the dashboard to see the working Gantt chart component. If you make any updates to the component attributes, refresh the dashboard in preview mode to render the changes.
Using the Word Cloud 2 Component
To test and play with this component, create a custom query in the dashboard editor. Use the Opportunities dataset to create a compare table query with a column for Count of Rows and a column for Scaled Size. Make the Scaled Size column a formula of A/10. Group the columns by Account.Industry.
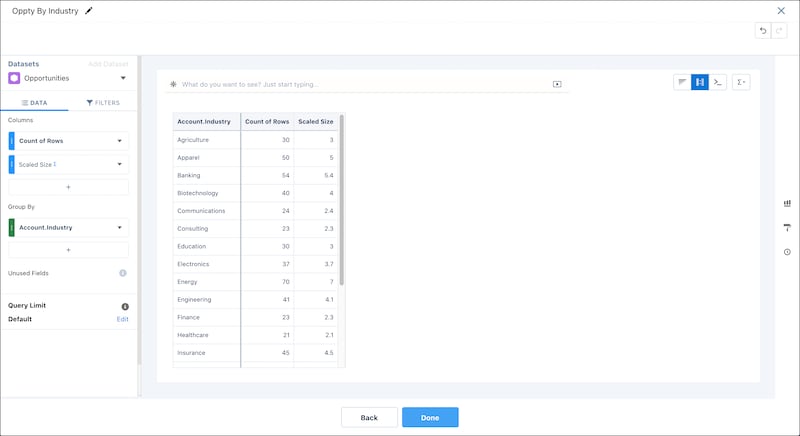
Drop a component on the dashboard, select Word Cloud 2 from the Lightning Components list, and use Existing Query to set the custom static query as the component step.
In the component properties menu, set the Component Attributes to these values.
- Words - Account.Industry
- Measure Column - Scaled Size
- Height - 400
- Width - 1000
- Min Text Size - 20
Save your work and preview the dashboard to see the working word cloud component. If you make any updates to the component attributes, refresh the dashboard in preview mode to render the changes.
Creating a query first isn’t required. You can also create a query when the component is added to the dashboard. You have the choice to select fields from the existing dataset or to change the data source to another dataset and then select fields.
Note
See Also
 j
j