


arimax
Uses existing data to predict future data points. The arimax statement must follow a projection statement in your query. Perform any filtering pre-projection or after the arimax statement.
The arimax statement requires a CRM Analytics Growth or CRM Analytics Plus license to return a full set of results.
Note
Usage
arimax is a variant of the timeseries statement that provides a different algorithm to predict data points. Use arimax when you want predictions performed with a more general model that can take multiple variables.
Syntax
1result = arimax resultSet generate measure1 as fmeasure1 with (parameters);parameters can have these values:
-
arimaOrder(required ifseasonalOrderisn’t specified) Specify the order for the ARIMA model. For example,arimaOrder=(p,d,q), wherep,d, andqare integers. The integer values must be between0and5.pis the AR order,dis the degree of differencing, andqis the MA order.Note
-
seasonalOrder(required ifarimaOrderisn’t specified) Specify the seasonal order for the ARIMA model. For example,seasonalOrder=(P,D,Q,s), whereP,D,Qare integers andsis the period. The integer values must be between0and5. Thesvalue must be0or between2and24.scan only be0whenP,D, andQare also all0.Pis the seasonal AR order,Dis the degree of seasonal differencing,Qis the seasonal MA order, andsis the seasonal periodicity.Note
-
xreg(optional) External regressors or co-factors. For example,xreg=('col1','col2',...). The values forxregmust be measures. The maximum number ofxregfields allowed is 10. -
xregFutures(optional) Future scenario data for thexregparameter as a map of values arrays. The number of values in each array must match the value for thelengthparameter. The key for each array value is the name of anxregmeasure.
If seasonalOrder and dateType aren’t specified in the query, the algorithm runs an auto-param search on a few popular seasonalities to find the best fit.
Note
arimax also supports the following timeseries parameters, with the same meaning and behavior.
-
length(required) Number of points to predict. For example, iflengthis 6 and thedateColstype string isY-M,arimaxpredicts data for 6 months.If you want to use
dateColsbut your data stream has missing dates, usefillbefore usingarimax.Note
-
dateCols(optional) Date fields to use for grouping the data, plus the date column type string. For example,dateCols=(CloseDate_Year, CloseDate_Month, "Y-M"). Date columns are projected automatically. Allowed values are:YearField, MonthField, "Y-M"YearField, QuarterField, "Y-Q"YearField, "Y"YearField, MonthField, DayField "Y-M-D"YearField, WeekField "Y-W"
-
ignoreLast(optional) Iftrue,arimaxdoesn’t use the last time period in the calculations. The default isfalse.Set this parameter to
trueto improve the accuracy of the forecast if the last time period contains incomplete data. For example, if you’re partway through the quarter,arimaxforecasts more accurately if you set this parameter totrue. -
order(optional) Specify the field to use for ordering the data. Mandatory ifdateColsisn’t used. By default, this field is sorted in ascending order. Usedescto specify descending order, for exampleorder=('Type' desc). You can also order by multiple fields, for exampleorder=('Type' desc, 'Group' asc).For example, suppose that your data has no date columns, but it has a measure column called Week. Use
order='Week'.Specify either
dateColsororder.Note
-
partition(optional) Specify the column used to partition the data. The column must be a dimension. Thearimaxcalculation is done separately for each partition to ensure that each partition uses the most accurate algorithm. For example, data in one partition can have a seasonal variation while data in another partition doesn’t. The partition columns are projected automatically.For example, suppose that your sales data for raw materials contains the date sold, type of raw material, and the weight sold. To predict the future weight sold for each type of raw material, use
partition='Type'. -
predictionInterval(optional) Specify the uncertainty, or confidence interval, to display at each point. Allowed values are80and95. The upper and lower bounds of the confidence interval are projected in columns namedcolumn_name_low_95andcolumn_name_high_95.
arimax doesn’t support missing data values in the forecast or xreg measures. You must pre-process your data to replace missing values in the query before calling arimax
Note
.
Syntax Examples
-
Use
arimaxwith thearimaOrderparameter.1q = arimax q generate 'Value' as 'fValue' with (length=10, dataCols=('Year', 'Month', 'Day', "Y-M-D"), arimaOrder=(1,0,1)); -
Use
arimaxwith thearimaOrder,xreg, andignoreLastparameters.1q = arimax q generate 'Value' as 'fValue' with (length=10, dataCols=('Year', 'Month', 'Day', "Y-M-D"), arimaOrder=(1,0,1), xreg=('Price', 'Cost'), ignoreLast=true); -
Use multiple columns in the
arimaxforecast. Ifxregis specified, multiple columns aren’t allowed.= arimax q generate 'Value' as 'fValue', 'Value2' as 'fValue2' with (length=10, dataCols=('Year', 'Month', 'Day', "Y-M-D"), arimaOrder=(1,0,1)); -
Use
arimaxwith thearimaOrder,seasonalOrder, andxregparameters.1q = arimax q generate 'Value' as 'fValue' with (length=10, dataCols=('Year', 'Month', 'Day', "Y-M-D"), arimaOrder=(1,0,1), seasonalOrder=(1,0,1,4), xreg=('Price', 'Cost'));
seasonality | dateCols | Type of Seasonality |
|---|---|---|
seasonalOrder=(1,0,1,4) | dateCols=('Year','Quarter',"Y-Q") | Yearly seasonality, because there are 4 quarters in a year. |
seasonalOrder=(1,0,1,12) | dateCols=('Year','Month',"Y-M") | Yearly seasonality, because there are 12 months in a year. |
seasonalOrder=(1,0,1,7) | dateCols=('Year','Month','Day',"Y-M-D") | Weekly seasonality, because there are 7 days in a week. |
When the date type in the dateCols value doesn’t match the seasonal periodicity in seasonalOrder, the seasonal periodicity takes precedence. For example, if dateCols=('Year','Month',"Y-M") and seasonalOrder=(1,0,1,4) are in the same arimax statement, the seasonal period used for predictions is 4 or "Y-Q", not "Y-M".
Note
Use Case Examples
Suppose you have a dataset with 5 years of monthly power usage for a city, along with the corresponding average temperature and precipitation for each month.
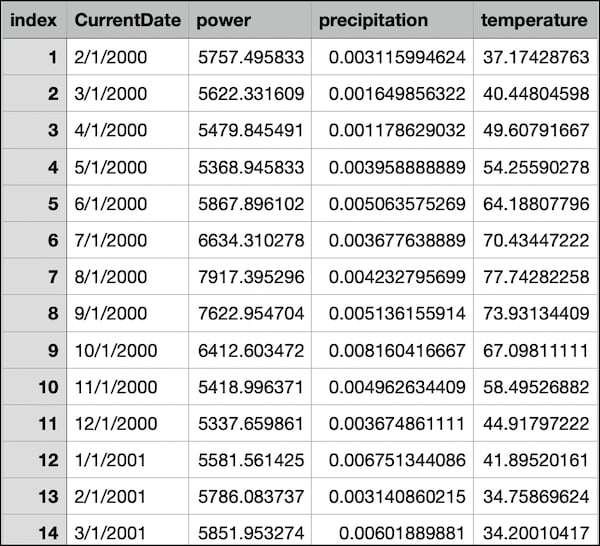
You can use a seasonal arimax query to predict the next 12 months of power usage, refining each prediction by adding more parameters to your query. Start with a single variable prediction, then make it multivariate by adding xreg, and finally, create a what-if analysis by adding xregFutures. For each visualization, a timeline chart is used, with Axis Mode set to Single Axis, Show Value As set to Compact Number, and a predictive line added to the X-Axis.
Seasonal Query
Use a seasonal arimax query to predict how much power the city will use in the upcoming year.
1q = load "nyc_power_dates3";
2q = group q by (CurrentDate_Year, CurrentDate_Month);
3q = foreach q generate CurrentDate_Year, CurrentDate_Month, sum(power) as power;
4q = arimax q generate power as fPower with (length=12, dateCols=(CurrentDate_Year, CurrentDate_Month, "Y-M"), arimaOrder=(0,1,1), seasonalOrder=(0,1,1,12));
5q = foreach q generate 'CurrentDate_Year' + "~~~" + 'CurrentDate_Month' as 'CurrentDate_Year~~~CurrentDate_Month', fPower;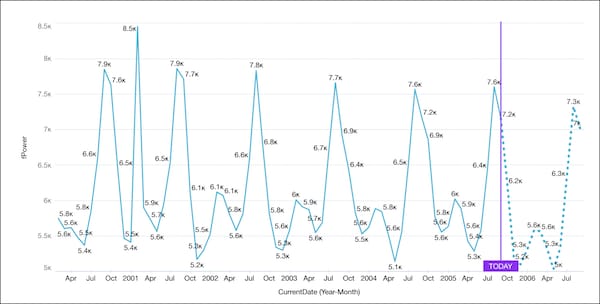
Multivariate Seasonal Query
Use a seasonal multivariate arimax query to predict how much power the city will use, using the temperature and precipitation measures in the calculation of the predicted values.
1q = load "nyc_power_dates3";
2q = group q by (CurrentDate_Year, CurrentDate_Month);
3q = foreach q generate CurrentDate_Year, CurrentDate_Month, sum(power) as power, sum(temperature) as temperature, sum(precipitation) as precipitation;
4q = arimax q generate power as fPower with (length=12, dateCols=(CurrentDate_Year, CurrentDate_Month, "Y-M"), xreg=(temperature, precipitation), arimaOrder=(0,1,1), seasonalOrder=(0,1,1,12));
5q = foreach q generate 'CurrentDate_Year' + "~~~" + 'CurrentDate_Month' as 'CurrentDate_Year~~~CurrentDate_Month', fPower, temperature, precipitation;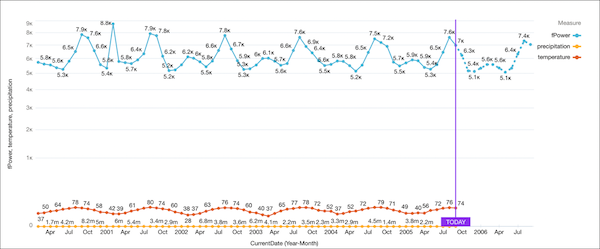
Multivariate Seasonal Query with Prediction Interval
Use a seasonal multivariate arimax query to predict how much power the city will use, using the temperature and precipitation measures in the calculation of the predicted values. Then, add a predictionInterval to show the prediction with 95% accuracy
1q = load "nyc_power_dates3";
2q = group q by (CurrentDate_Year, CurrentDate_Month);
3q = foreach q generate CurrentDate_Year, CurrentDate_Month, sum(power) as power, sum(temperature) as temperature, sum(precipitation) as precipitation;
4q = arimax q generate power as fPower with (length=12, predictionInterval=95 dateCols=(CurrentDate_Year, CurrentDate_Month, "Y-M"), xreg=(temperature, precipitation), arimaOrder=(0,1,1), seasonalOrder=(0,1,1,12));
5q = foreach q generate 'CurrentDate_Year' + "~~~" + 'CurrentDate_Month' as 'CurrentDate_Year~~~CurrentDate_Month', fPower, fPower_high_95, fPower_low_95;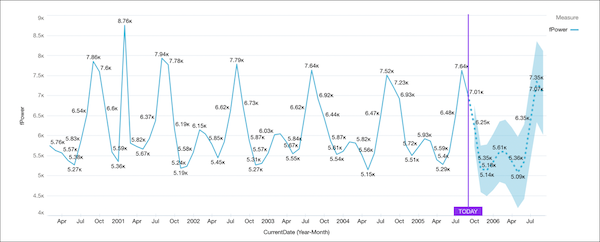
What-If Analysis Query
Use the xregFutures parameter to provide possible future values for xreg fields to see what the effects are on the forecasted fields for different sets of values
1q = arimax q generate 'Value' as 'fValue' with (length=6, dateCols=('Year','Month','Day', "Y-M-D"),
2 arimaOrder=(1,0,1), xreg=('col1', 'col2'), xregFutures=(col1: [1.0, 2.0, 3.0, 4.0, 5.0, 6.0], col2: [1.1, 2.2 3.3, 4.4, 5.5, 6.6]));
The user can pass in values for xreg fields that they want to do the what-if analysis on.
Add xregFutures to the seasonal multivariate arimax query to predict how much power the city will use with future temperature and precipitation values. In this query, the final 6 temperature future values have been increased by 10 degrees each to alter the calculated values in the visualization.
1q = load "nyc_power_dates3";
2q = group q by (CurrentDate_Year, CurrentDate_Month);
3q = foreach q generate CurrentDate_Year, CurrentDate_Month, sum(power) as power, sum(temperature) as temperature, sum(precipitation) as precipitation;
4q = arimax q generate power as fPower with (length=12, dateCols=(CurrentDate_Year, CurrentDate_Month, "Y-M"),
5xreg=(temperature, precipitation), arimaOrder=(0,1,1), seasonalOrder=(0,1,1,12),
6xregFutures=(temperature: [67.09, 58.49, 44.91, 41.89, 34.75, 34.20, 39.18, 61.51, 70.59, 82.13, 89.54, 84.12],
7precipitation: [0.0081, 0.0049, 0.0036, 0.0067, 0.0031, 0.0060, 0.0053, 0.0015, 0.0050, 0.0079, 0.0028, 0.0034]));
8q = foreach q generate 'CurrentDate_Year' + "~~~" + 'CurrentDate_Month' as 'CurrentDate_Year~~~CurrentDate_Month', fPower, temperature, precipitation;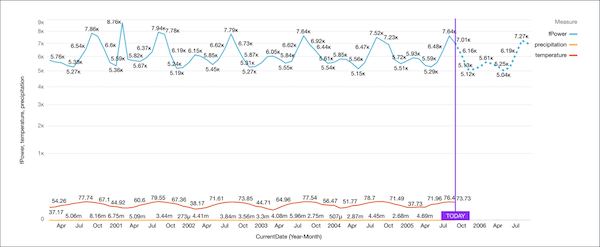
See Also
 j
j