ISVforce Guide
 j
jNewer Version Available
Activity Summary in the Marketplace Analytics Dashboard
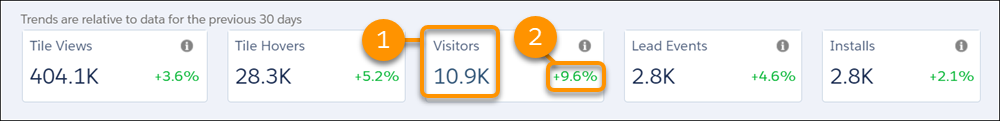
Use the activity summary to check your AppExchange listing’s key metrics: tile views,
tile hovers, visitors, lead events, and installs. Each activity metric includes a trend indicator
to compare how your listing is performing relative to previous time periods.
| Element | Description |
|---|---|
| Activity Metric (1) | Number of times that an event or interaction occurred during a time period. For values over 1,000, the dashboard shows a rounded number. To view the exact number, hover over the metric. |
| Trend Indicator (2) | Percentage change relative to a previous time period. A positive value represents a period-over-period increase, and a negative value represents a period-over-period decrease. |
The default time period is 30 days, but you can choose another fixed time period or define a custom one.
Example
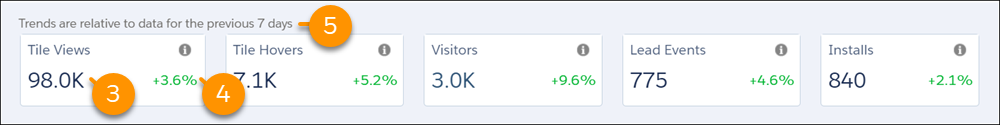
This summary of the example solution called Appy’s Maps shows that it received 98,000 tile views (3) in the past 7 days, which is a 3.6% increase (4) compared to the previous 7-day period (5).