ISVforce Guide
 j
jNewer Version Available
Activity Summary in AppExchange Marketplace Analytics
Check your listing’s key metrics in the activity summary area in AppExchange Marketplace
Analytics. The Analytics
tab helps you understand how customers engage with your listings. Track activity sources, lead
events, top searches, customer engagements, and chat engagements to see what's working. Monitor
your promotions with the Co-Marketing Performance timeline and evaluate your listings through key
metrics like tile views, tile hovers, visitors, lead events, and
installs.
Trend indicators show metric performance compared to a previous time period. By default,
Marketplace Analytics shows metrics for the past 30 days, but you can choose another fixed time
period or define a custom date range.
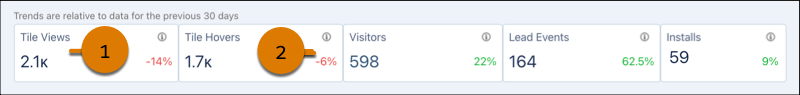
| Element | Description |
|---|---|
| Metric (1) | Number of times that an event or interaction occurred during a time period. For values over 1,000, the dashboard shows a rounded number. To view the exact number, hover over the metric. |
| Trend Indicator (2) | Percentage change in the metric compared to a previous time period. A positive value
represents a period-over-period increase. A negative value represents a period-over-period
decrease. Trends are available for these time periods.
|
Example
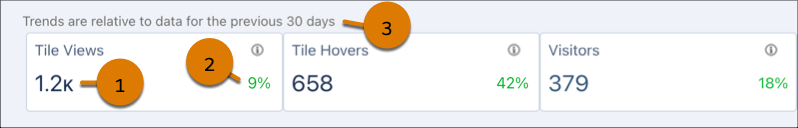
In this example, a solution called Appy’s Maps received 1,200 tile views (1) in the past 30 days, a 9% increase (2) compared to the previous 30-day period (3).