ISVforce Guide
 j
jNewer Version Available
AppExchange Marketplace Analytics Activity Summary
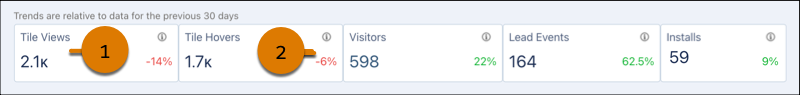
Check your listing’s key metrics in the activity summary area in AppExchange Marketplace
Analytics. On the Home tab, see a summary of tile views, tile hovers, visitors, lead events, and
installs. On the AMP Insights tab, see a summary of sponsored tile views, sponsored tile hovers,
visitors, lead events, and installs. Trend indicators show metric performance compared to a
previous time period. By default, Marketplace Analytics shows metrics for the past 30 days, but
you can choose another fixed time period or define a custom date range.
| Element | Description |
|---|---|
| Metric (1) | Number of times that an event or interaction occurred during a time period. For values over 1,000, the dashboard shows a rounded number. To view the exact number, hover over the metric. |
| Trend Indicator (2) | Percentage change in the metric compared to a previous time period. A positive value
represents a period-over-period increase. A negative value represents a period-over-period
decrease. Trends are available for these time periods.
|
Example
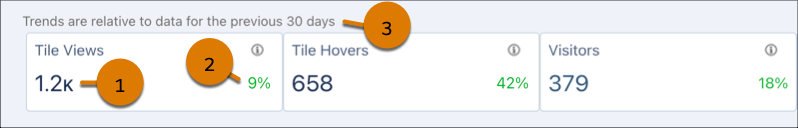
In this example, a solution called Appy’s Maps received 1,200 tile views (1) in the past 30 days, a 9% increase (2) compared to the previous 30-day period (3).