Mobile and Offline Developer Guide
 j
jNewer Version Available
Debug in Android
Follow these steps to attach Chrome DevTools in your browser to the webview of the Test
Harness app.
- On your emulated Android device, open the Settings app.
- Enter About emulated device into the search bar, and tap the result titled About emulated device.
-
Scroll to the bottom of the page and tap Build number seven times.
The message “You are now a developer!” appears after the seventh tap, meaning that developer mode is enabled for the emulator.
You only need to do this step once for each emulated device you use for development.
- Launch Chrome on your desktop. In the location bar, enter chrome://inspect/#devices.
-
Select Inspect for the WebView under the Remote Target emulator
you’re using.
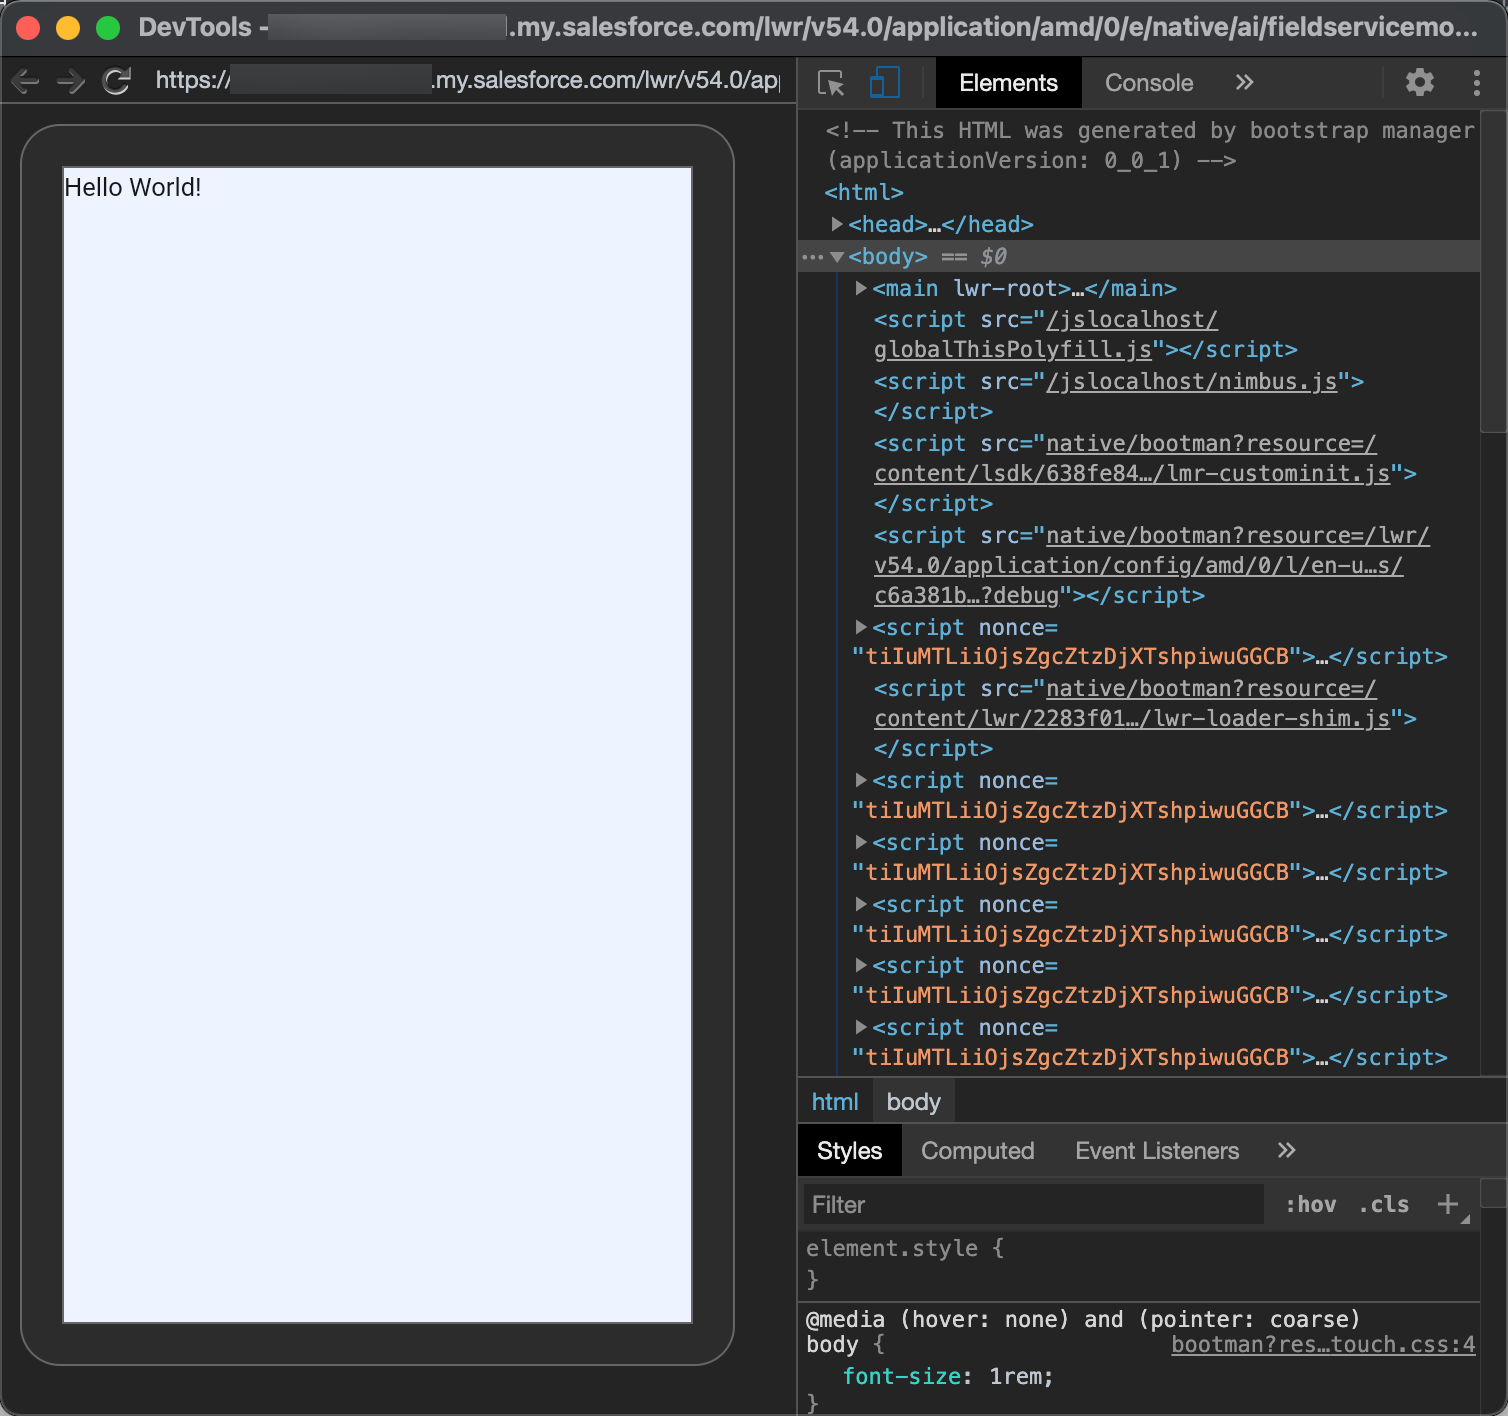
A window appears containing your emulator with Chrome DevTools connected to it. You can use Chrome DevTools to inspect the LWC element, set breakpoints, and see the console output. You can use standard web development techniques for working with HTML, CSS, and JavaScript to run, test, debug, and improve your LWC.
For additional information on the basics of debugging with Chrome Developer Tools, see Remote debugging WebViews (Google).
For a deeper dive on debugging JavaScript in an embedded WebView of an Android mobile app, see Debugging embedded JavaScript in an Android app using Chrome DevTools.