Analytics SAQL Developer Guide
 j
jDynamically Display Your Top Five Reps with Windowing
Windowing functions perform calculations over a dynamic range.
Example - Dynamically Display Your Top Five Reps
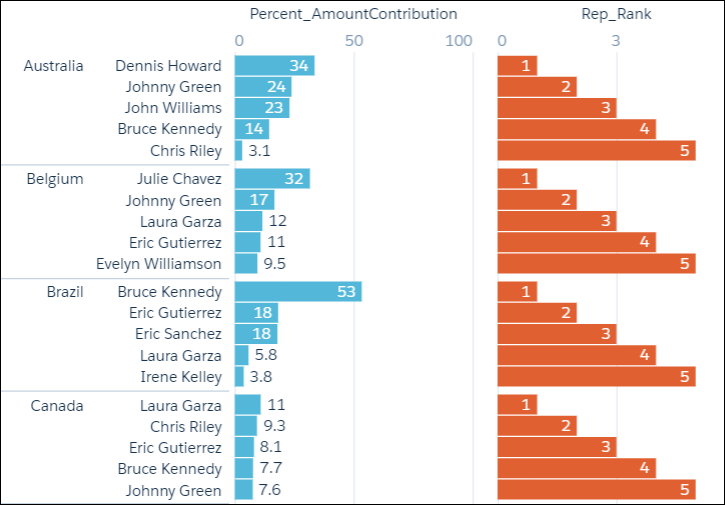
Use windowing to create a chart that dynamically displays your top-five reps
for each country. The chart updates continuously as opportunities are won.
The example uses windowing to calculate:
- Percentage contribution that each rep made to the total amount, partitioned by country
- Ranking of the rep’s contribution, partitioned by country
1q = load "DTC_Opportunity_SAMPLE";
2q = group q by ('Billing_Country', 'Account_Owner');
3
4q = foreach q generate 'Billing_Country', 'Account_Owner',
5
6-- sum(Amount) is the total amount for a single rep in the current country
7-- sum(sum('Amount') is the total amount for ALL reps in the current country
8-- sum(Amount) / sum(sum('Amount') calculates the percentage that each rep contributed
9-- to the total amount in the current country
10((sum('Amount')/sum(sum('Amount'))
11
12
13-- [..] means "include all records in the partition"
14-- "by Billing_Country" means partition, or group, by country
15over ([..] partition by 'Billing_Country')) * 100) as 'Percent_AmountContribution',
16
17-- rank the percent contribution and partition by the country
18rank() over ([..] partition by ('Billing_Country') order by sum('Amount') desc ) as 'Rep_Rank';
19
20-- filter to include only the top 5 reps
21q = filter q by 'Rep_Rank' <=5;
The resulting graph shows the top-five reps in each country and displays each rep’s ranking.