


Field Service Developer Guide
 j
jNote: This release is in preview. Features described here don’t become generally available until the latest general availability date that Salesforce announces for this release. Before then, and where features are noted as beta, pilot, or developer preview, we can’t guarantee general availability within any particular time frame or at all. Make your purchase decisions only on the basis of generally available products and features.
Debug in Android
Connect Chrome DevTools on your desktop to the WebView in the Field Service mobile app
where your LWC is running.
- On your emulated Android device, open the Settings app.
- Enter About emulated device into the search bar and click it.
-
Scroll to the bottom of the page and click Build number seven
times.
The message “You are now a developer!” appears when you click it enough, indicating that developer mode is enabled for the emulator.
- Launch Chrome on your desktop.
- In the location bar, enter chrome://inspect/#devices.
- Click Inspect for the WebView under the Remote Target emulator you’re using.
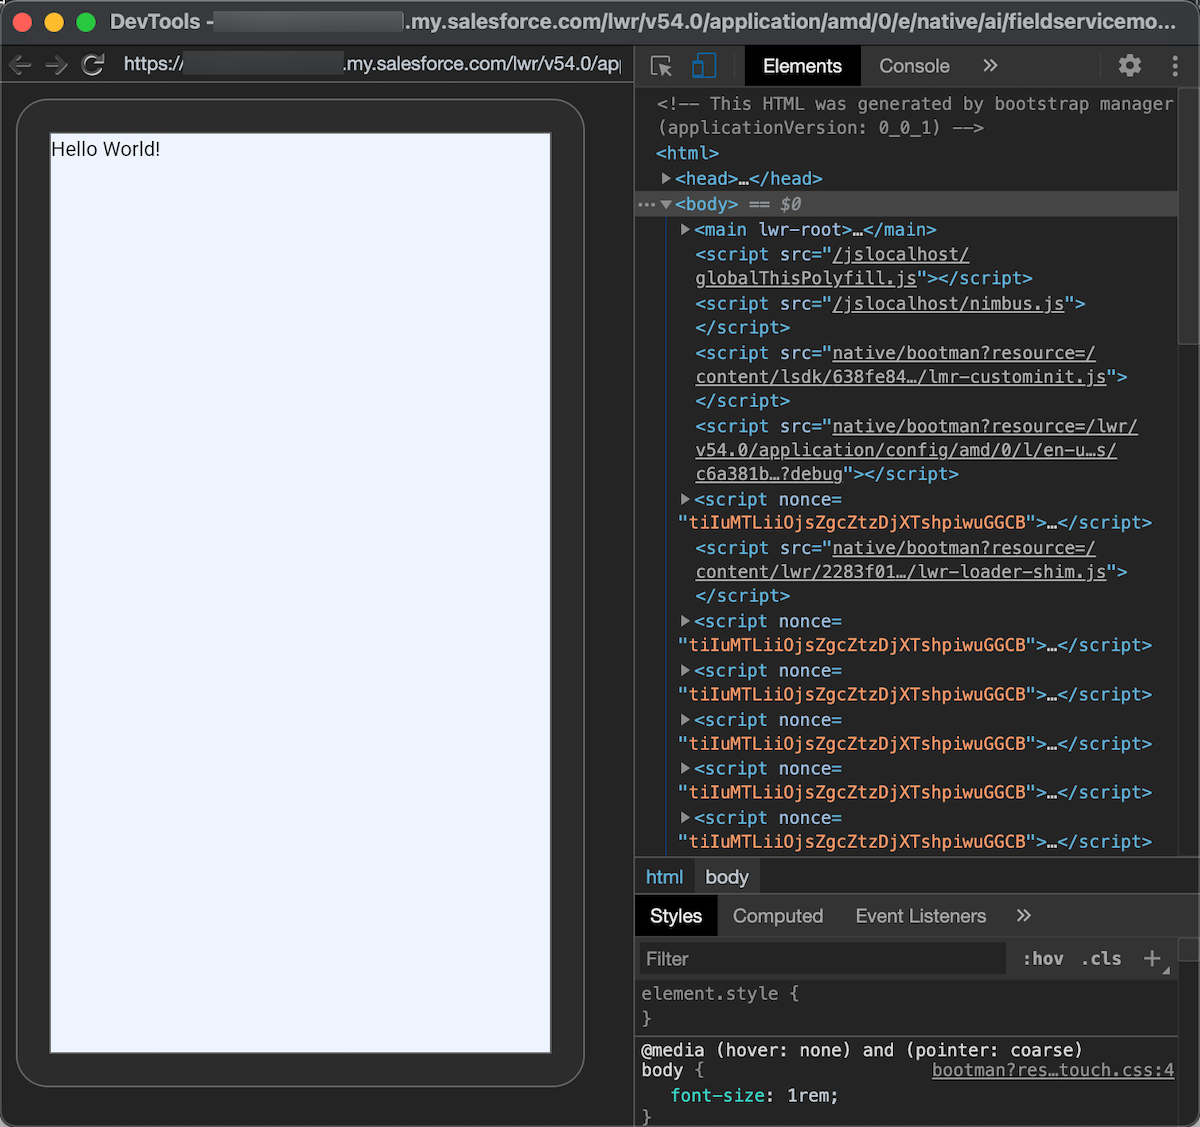
A window appears containing your emulator with Chrome DevTools connected to it. You can
use Chrome DevTools to inspect the LWC element, set breakpoints, and see the console output.
As with iOS, you can use the standard web development techniques for working with HTML,
JavaScript, and CSS to run, test, debug, and improve your LWC.
See Remote debugging WebViews for additional basics, and Debugging embedded JavaScript in an Android app using Chrome DevTools for a deep dive on debugging JavaScript in an embedded WebView of an Android mobile app.