


Visualforce Developer Guide
 j
jNote: This release is in preview. Features described here don’t become generally available until the latest general availability date that Salesforce announces for this release. Before then, and where features are noted as beta, pilot, or developer preview, we can’t guarantee general availability within any particular time frame or at all. Make your purchase decisions only on the basis of generally available products and features.
Providing Chart Data via a Controller Method
On the server side, write a controller method that returns a List of objects, which can be your own Apex wrapper objects as in A Simple Charting Example, sObjects, or AggregateResult objects. The method is evaluated server-side, and the results serialized to JSON. On the client, these results are used directly by <apex:chart>, with no further opportunity for processing.
To illustrate this technique with sObjects, here is a simple controller that returns a list of Opportunities, and a bar chart for their amounts:
1public class OppsController {
2
3    // Get a set of Opportunities
4    public ApexPages.StandardSetController setCon {
5        get {
6            if(setCon == null) {
7                setCon = new ApexPages.StandardSetController(Database.getQueryLocator(
8                      [SELECT name, type, amount, closedate FROM Opportunity]));
9                setCon.setPageSize(5);
10            }
11            return setCon;
12        }
13        set;
14    }
15
16    public List<Opportunity> getOpportunities() {
17         return (List<Opportunity>) setCon.getRecords();
18    }
19}1<apex:page controller="OppsController">
2 <apex:chart data="{!Opportunities}" width="600" height="400">
3 <apex:axis type="Category" position="left" fields="Name" title="Opportunities"/>
4 <apex:axis type="Numeric" position="bottom" fields="Amount" title="Amount"/>
5 <apex:barSeries orientation="horizontal" axis="bottom"
6 xField="Name" yField="Amount"/>
7 </apex:chart>
8 <apex:dataTable value="{!Opportunities}" var="opp">
9 <apex:column headerValue="Opportunity" value="{!opp.name}"/>
10 <apex:column headerValue="Amount" value="{!opp.amount}"/>
11 </apex:dataTable>
12</apex:page>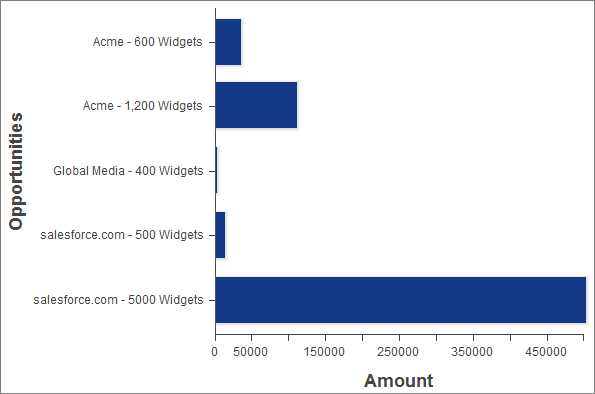
- The Visualforce chart components access the data attributes from a List of Opportunity sObjects the same way as from the simple Data object used in A Simple Charting Example.
- The object field names used as data attributes are case-sensitive in JavaScript while field names in Apex and Visualforce are case-insensitive. Be careful to use the precise field name in the fields, xField, and yField attributes of axes and data series components, or your chart will silently fail.