Analytics SAQL 開発者ガイド
 j
junion
複数の結果セットを 1 つの結果セットに結合します。結果セットの項目名と構造は同じでなければなりません。異なるデータセットを使用して各結果セットを作成するか、同じデータセットを使用できます。
構文
1result = union resultSetA, resultSetB [, resultSetC ...];例
1q = union q1, q2, q3;例
成立した商談の平均と比較して各営業担当の状況を確認したいとします。次の 2 つの結果セットを一緒に追加することでこの比較を行うことができます。次に、union を使用して、2 つの結果セットを追加します。
- 各営業担当の成立した商談金額の合計
- すべての営業担当の成立した商談金額の平均
まず、各営業担当の成立した商談金額の合計を表示します。
1opt = load "DTC_Opportunity_SAMPLE";
2opt = filter opt by 'Won' == "true";
3
4-- group by owner
5rep = group opt by 'Account_Owner';
6
7-- project the sum of amount for each rep
8rep = foreach rep generate 'Account_Owner' as 'Account_Owner', sum('Amount') as 'sum_Amount';
9
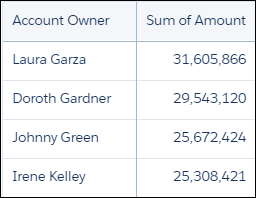
10rep = order rep by 'sum_Amount' desc;結果のグラフには、各営業担当の合計金額が表示されます。
次に、average 関数を使用して、各営業担当の合計金額の平均を計算します。
1-- grouping rep by all returns all the data in a single row.
2avg_rep = group rep by all;
3
4-- Calculate the average of the Sum of Amount column.
5-- Use the text ‘Average Deal Size’ in the ‘Account Owner’ column
6avg_rep = foreach avg_rep generate "Average deal size" as 'Account_Owner', avg('sum_Amount') as 'sum_Amount';
2 つのデータストリームは同じ項目名と構造を持つため、union を使用してそれらを組み合せることができます。
1q = union rep, avg_rep;結果のグラフには、営業担当別の合計金額と、1 営業担当あたりの平均金額が表示されます。

SAQL フラグメントを組み合わせて、完全な SAQL ステートメントにします。
1opt = load "DTC_Opportunity_SAMPLE";
2opt = filter opt by 'Won' == "true";
3
4-- group by owner
5rep = group opt by 'Account_Owner';
6
7-- project the sum of amount for each rep
8rep = foreach rep generate 'Account_Owner' as 'Account_Owner', sum('Amount') as 'sum_Amount';
9
10rep = order rep by 'sum_Amount' desc;
11
12-- grouping rep by all returns all the data in a single row.
13avg_rep = group rep by all;
14
15
16-- Calculate the average of the Sum of Amount column.
17-- Use the text ‘Average Deal Size’ in the ‘Account Owner’ column
18avg_rep = foreach avg_rep generate "Average deal size" as 'Account_Owner', avg('sum_Amount') as 'sum_Amount';
19
20q = union rep, avg_rep;