


Metadata Visualizer Extension
Overview
The Metadata Visualizer extension turns complex metadata into real-time diagrams. Instead of manually parsing raw metadata or waiting for deployment cycles to validate structure, developers can see how Salesforce metadata is organized and how data flows. This makes complex configurations and code designs easier to understand, analyze, and communicate.
Salesforce does not use customer data to train our LLMs.
Note
Current Capabilities
The Metadata Visualizer generates visual diagrams in real time from natural language prompts for any associated metadata in the code you build.
With Salesforce Metadata Visualizer, you can:
- Visualize metadata generated by AI using Agentforce Vibes or from your SFDX project.
- Understand complex metadata through clear visual diagrams.
- Customize diagram views based on a selected theme.
- See key elements such as fields, relationships, and properties.
Feature Highlights
Data Model: Navigate through metadata relationships with zoom, pan, and click interactions.
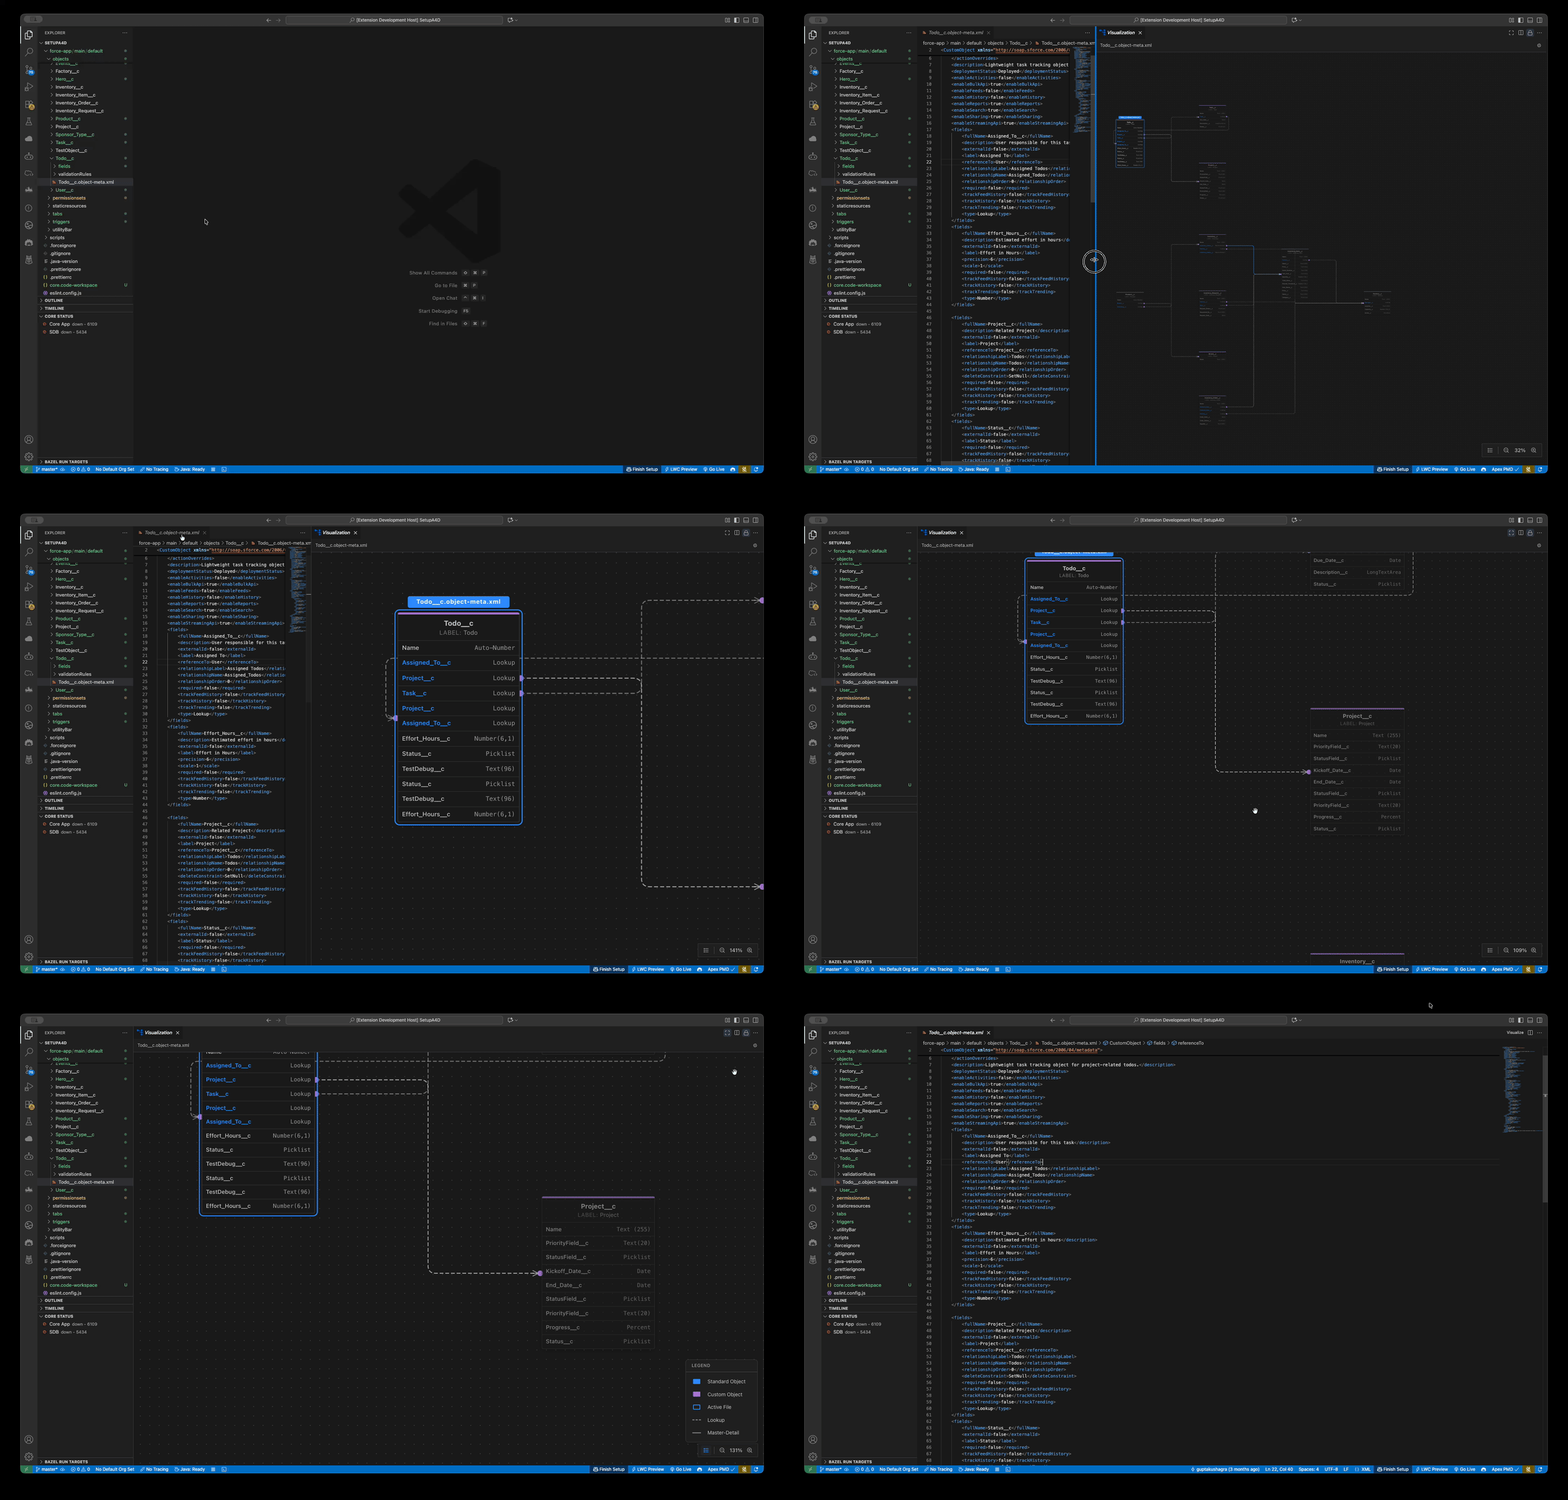
Agent Script: Navigate an agent structure and routing paths with clickable cards and drill-down interactions.

Flow: Navigate flow execution paths with collapsible elements and clickable nodes.

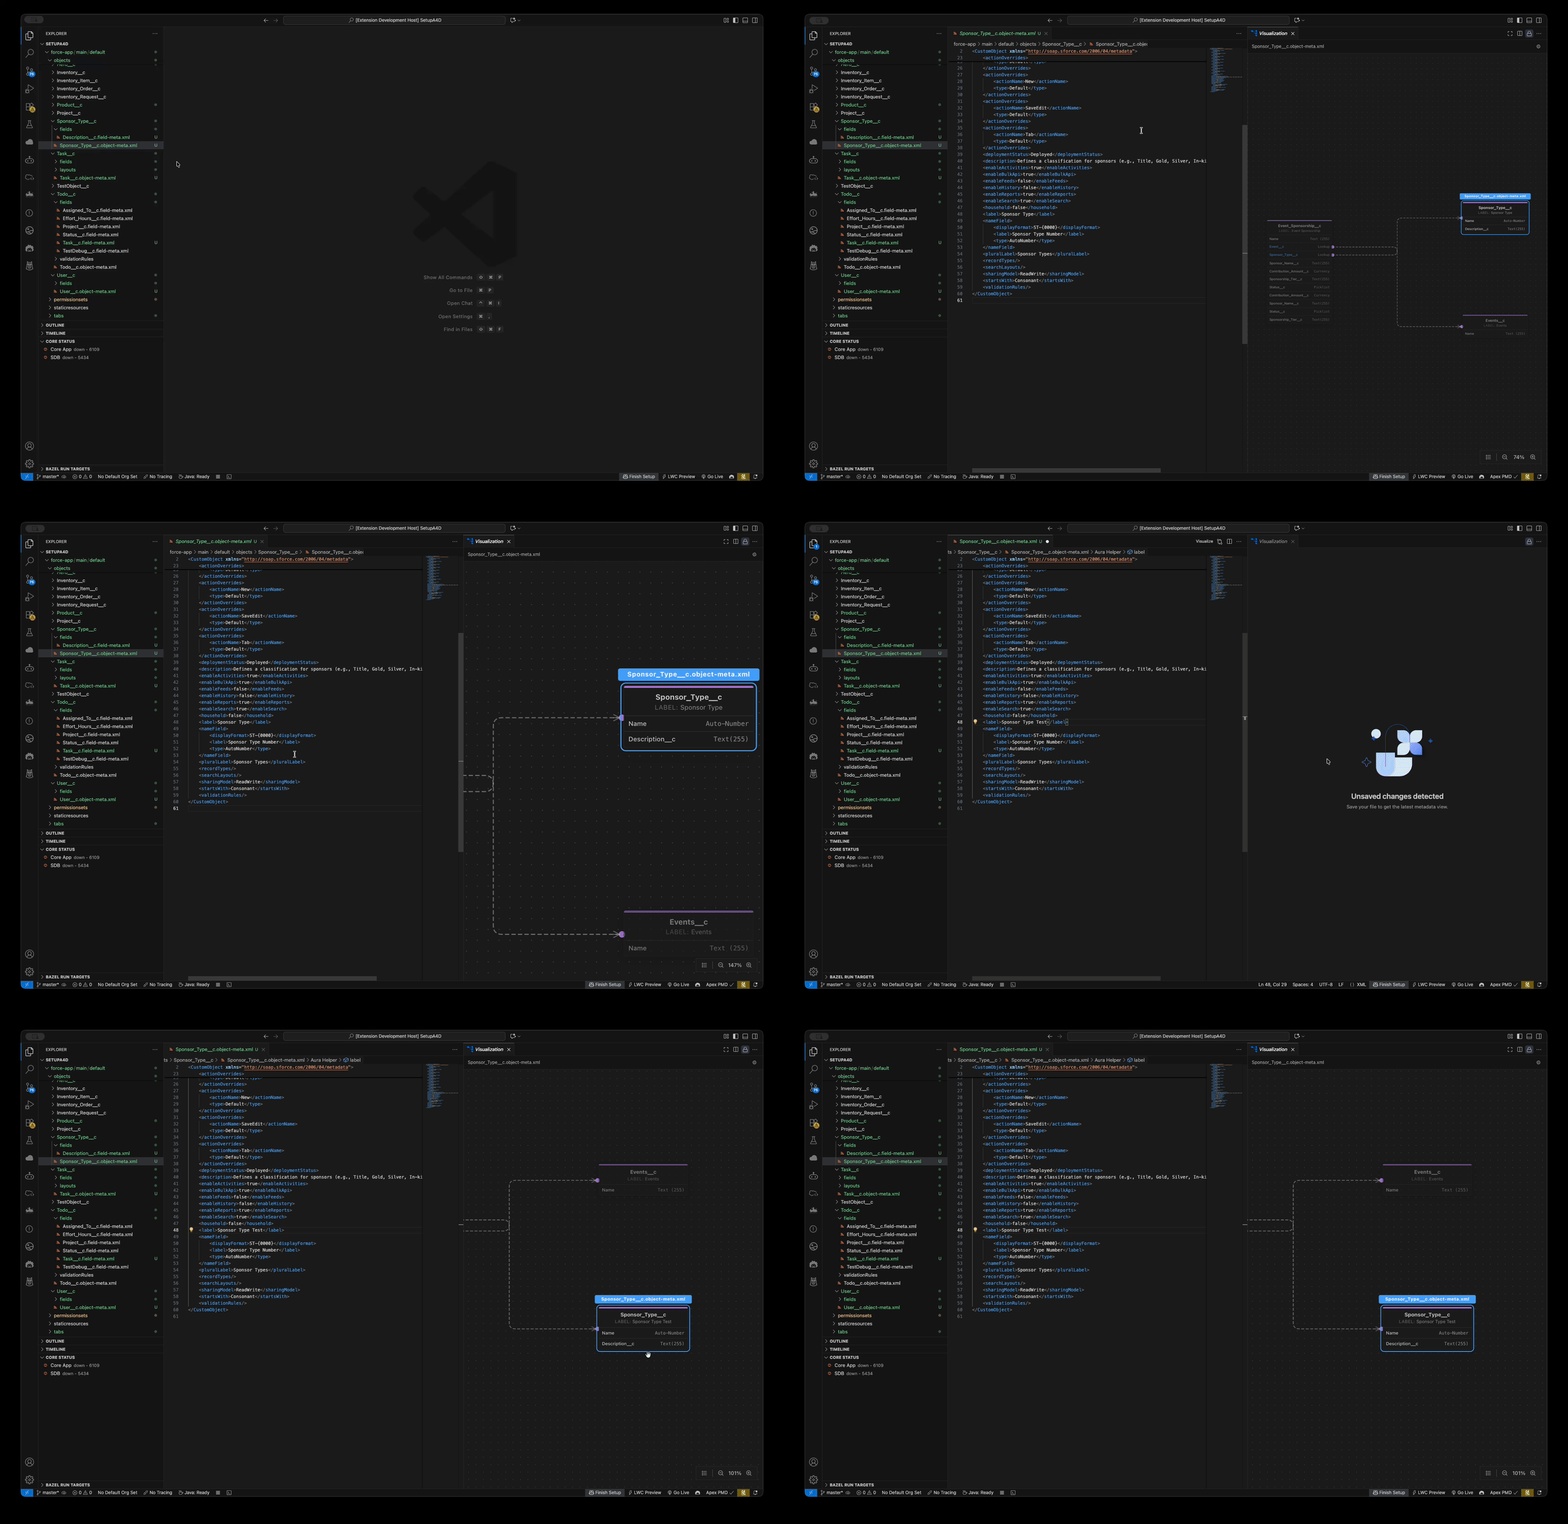
Real-Time Visualizations: Get real-time visualizations as you edit metadata files.
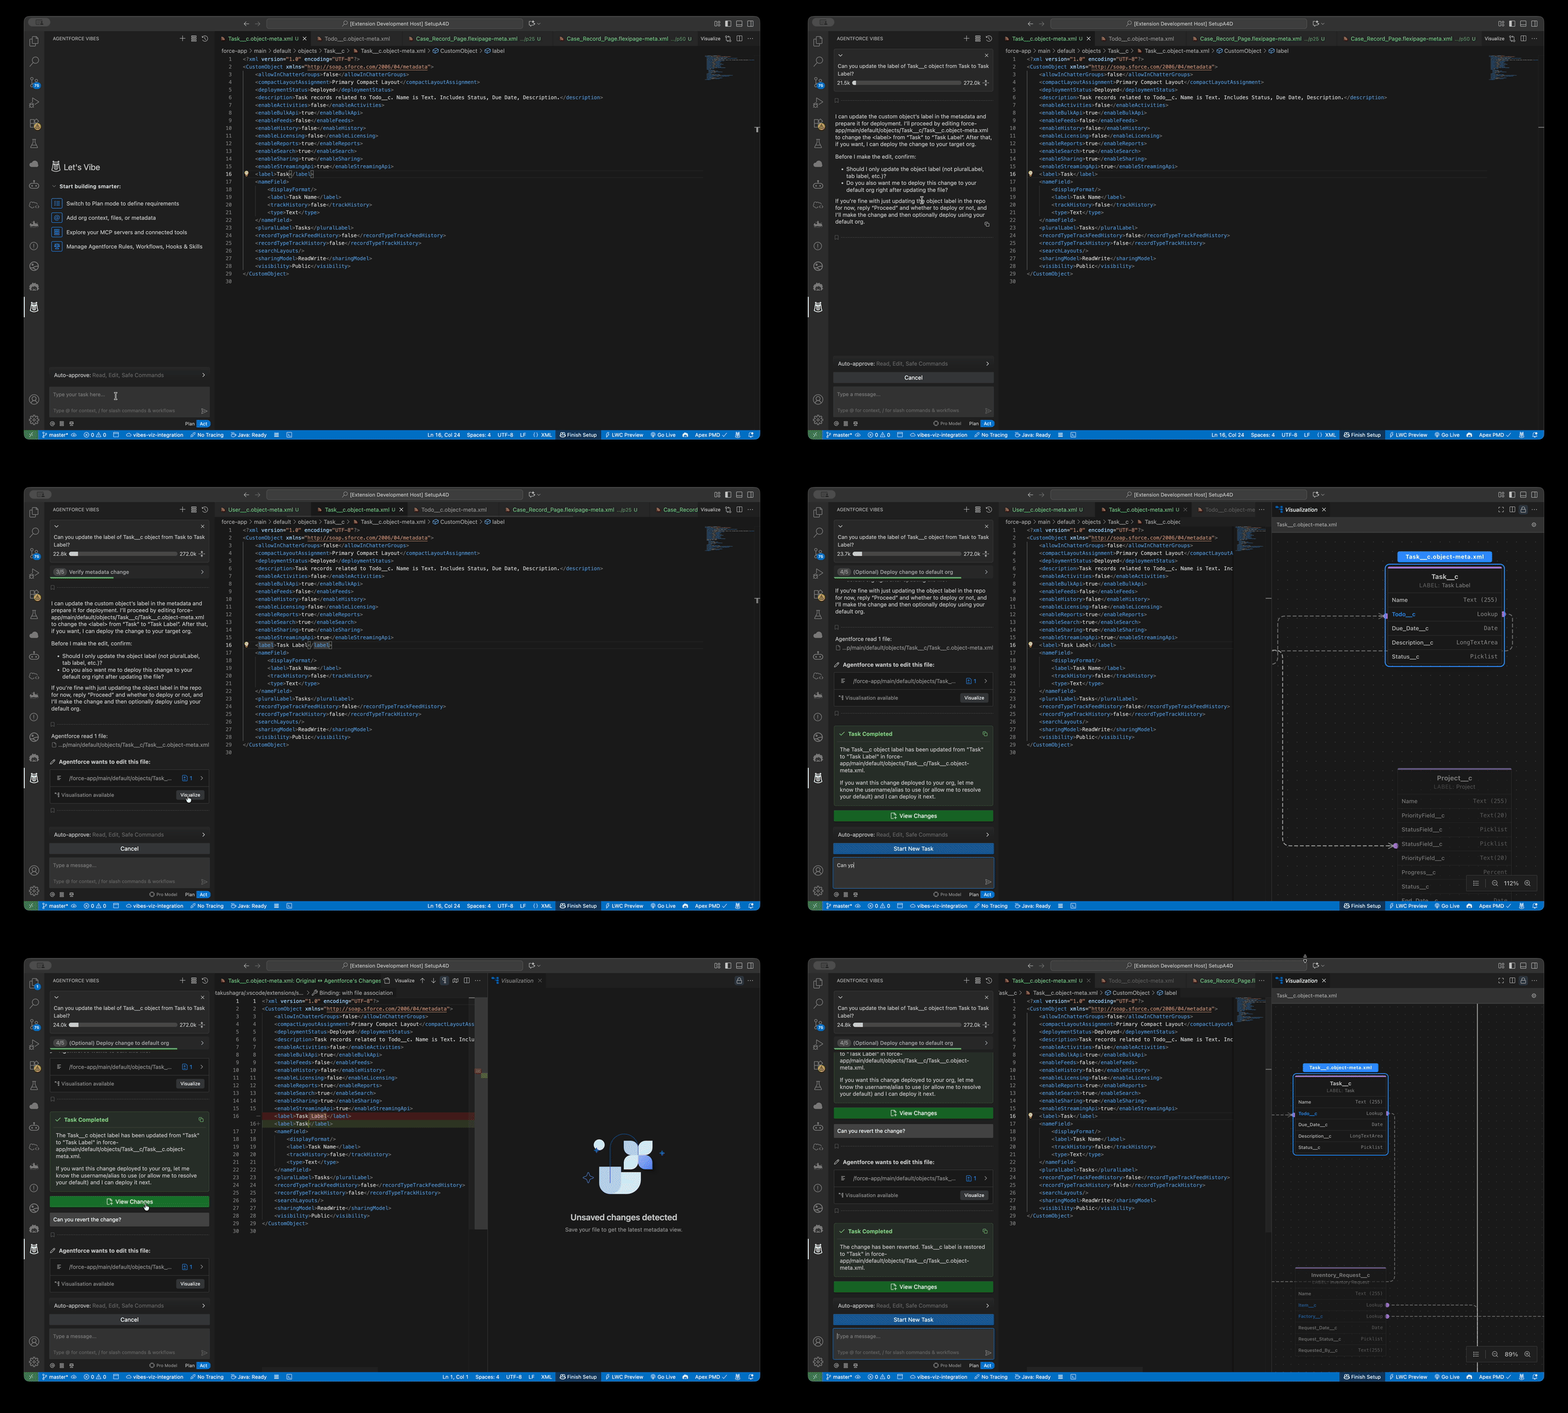
Agentforce Vibes Integration: Visualize metadata generated by Agentforce Vibes.
Supported Metadata Types for Visualization
| Metadata Type | Visualizer Details | Key Capabilities |
|---|---|---|
| Data Model | Visualize the metadata structure of objects, fields, and relationships in your SFDX project through an interactive entity relationship diagram (ERD). Launch the visualizer directly from any object or field XML file in your project. The diagram automatically centers on your “root” object and dynamically displays all related objects within its relationship hierarchy. |
|
| Flexipages (Beta) | Visualize the Flexipage metadata with all the regions, components, fields and their properties easily. |
|
| Agent Script | Visualize an agent’s structure and routing paths from the agent script files in an interactive hierarchy diagram. Launch the visualizer directly from any agent file in your project. Right-click it in your folder structure, or select Visualize after creating an agent in Agentforce Vibes. The diagram automatically centers on your main agent and displays a top-down hierarchy showing how incoming requests flow from the start agent to each subagent. Select any subagent card to view its full configuration. | Main Agent View
|
| Flow | Visualize the execution paths and decision logic of a flow from a flow metadata file in an interactive flowchart diagram. Launch the visualizer directly from any flow file in your project. The diagram displays the complete flow structure. Select any element to view its details in the left panel. |
|
| Permission Set | Visualize the permissions granted by a permission set in an easy-to-scan overview. Launch the visualizer directly from any permission set file in your project. Permission sets can be standard (active as soon as they’re assigned) or session-based (activated programmatically by Apex or Flow for the duration of a session). |
|
 j
j