


Analytics SAQL Developer Guide
 j
jNote: This release is in preview. Features described here don’t become generally available until the latest general availability date that Salesforce announces for this release. Before then, and where features are noted as beta, pilot, or developer preview, we can’t guarantee general availability within any particular time frame or at all. Make your purchase decisions only on the basis of generally available products and features.
Calculate the Slope of the Regression Line
Use SAQL to perform linear analysis on your data to find the line that best fits
the data. Then use .regr_slope to return the slope
of this line.
Example - Calculate the Relationship Between Number of Activities and Deal Amount
Suppose that you have a dataset that includes the number of activities (such as meetings) and the won opportunity amount.
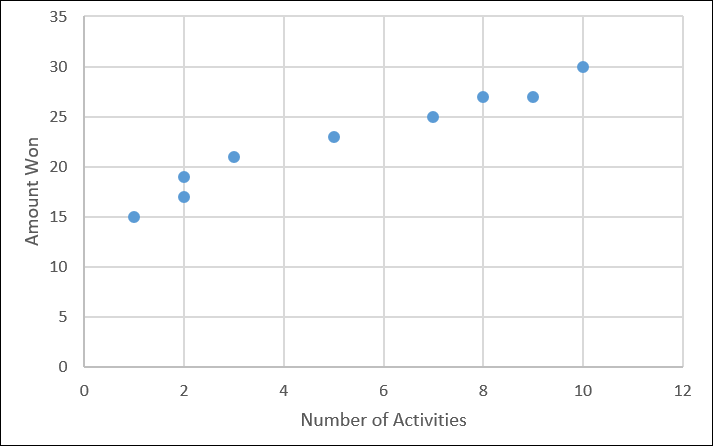
How much bigger will the deal size be for each extra activity? regr_slope performs a linear analysis on
your data then calculates the slope (that is, the increased amount you win
for each extra
activity).
1q = load "data/sales";
2q = group q by all;
3
4--trunc() truncates the result to two decimal places
5q = foreach q generate trunc(regr_slope('Amount', 'NumActivities'),2) as 'Gain per Activity';
Based on your existing data, every extra activity that you have tends to increase the deal size by $1.45 million, on average.
