Analytics SAQL Developer Guide
 j
jCalculate the Slope of the Regression Line
Use SAQL to perform linear analysis on your data to find the line that best fits
the data. Then use .regr_slope to return the slope
of this line.
Example - Calculate the Relationship Between Number of Activities and Deal Amount
Suppose that you have a dataset that includes the number of activities (such as meetings) and the won opportunity amount.
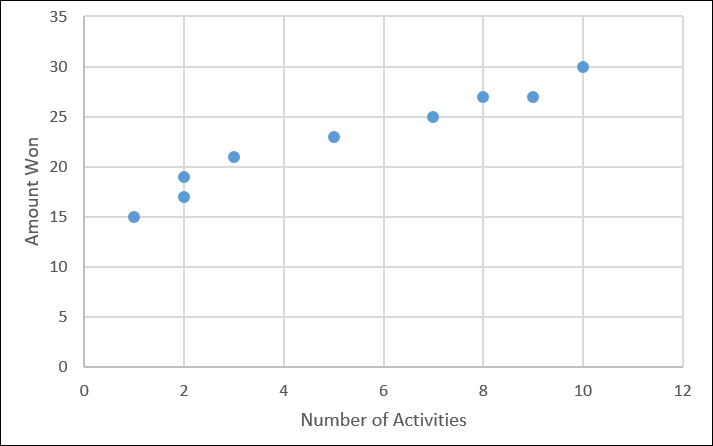
How much bigger will the deal size be for each extra activity? regr_slope performs a linear analysis on
your data then calculates the slope (that is, the increased amount you win
for each extra
activity).
1q = load "data/sales";
2q = group q by all;
3
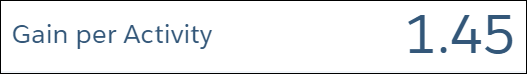
4--trunc() truncates the result to two decimal places
5q = foreach q generate trunc(regr_slope('Amount', 'NumActivities'),2) as 'Gain per Activity';Based on your existing data, every extra activity that you have tends to increase the deal size by $1.45 million, on average.