Analytics SAQL Developer Guide
 j
jNote: This release is in preview. Features described here don’t become generally available until the latest general availability date that Salesforce announces for this release. Before then, and where features are noted as beta, pilot, or developer preview, we can’t guarantee general availability within any particular time frame or at all. Make your purchase decisions only on the basis of generally available products and features.
Show the Top and Bottom Quartile
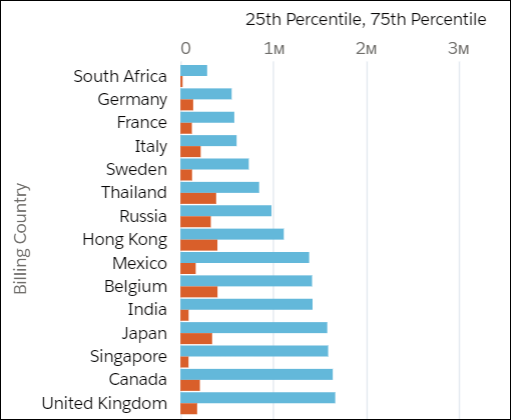
Example - Show Top Quartile and Bottom Quartile Deal Size by Country
Suppose that you want to see the top and bottom quartile deal size, by country. You want to see the size of the actual deal, not the interpolated (or 'average') deal size. Use percentile_disc(.25) and percentile_disc(.75).
1q = load "Data";
2q = group q by 'Billing_Country';
3q = foreach q generate 'Billing_Country' as 'Billing_Country', percentile_disc(0.25) within group (order by 'Amount' desc) as '25th Percentile', percentile_disc(0.75) within group (order by 'Amount' desc) as '75th Percentile';
4q = order q by '25th Percentile' asc;
Use a bar chart and select Axis Mode > Single Axis to show the top and bottom quartiles together.