Analytics SAQL Developer Guide
 j
jNote: This release is in preview. Features described here don’t become generally available until the latest general availability date that Salesforce announces for this release. Before then, and where features are noted as beta, pilot, or developer preview, we can’t guarantee general availability within any particular time frame or at all. Make your purchase decisions only on the basis of generally available products and features.
Dynamically Display Your Top Five Reps with Windowing
Windowing functions perform calculations over a dynamic range.
Example - Dynamically Display Your Top Five Reps
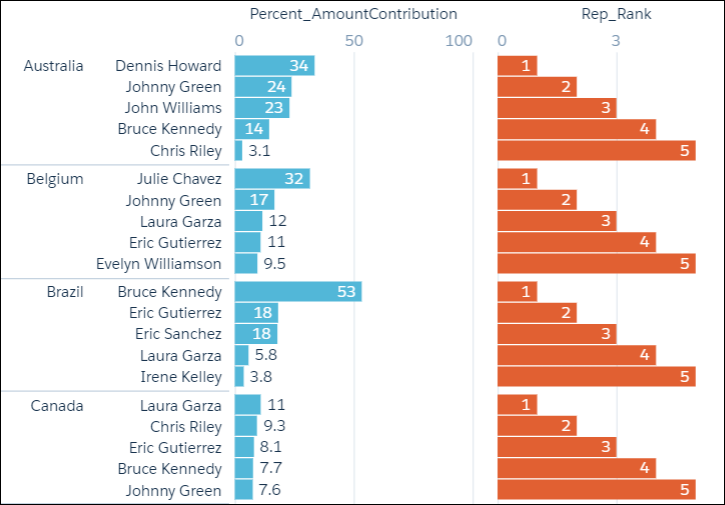
Use windowing to create a chart that dynamically displays your top-five reps
for each country. The chart updates continuously as opportunities are won.
The example uses windowing to calculate:
- Percentage contribution that each rep made to the total amount, partitioned by country
- Ranking of the rep’s contribution, partitioned by country
1q = load "DTC_Opportunity_SAMPLE";
2q = group q by ('Billing_Country', 'Account_Owner');
3
4q = foreach q generate 'Billing_Country', 'Account_Owner',
5
6-- sum(Amount) is the total amount for a single rep in the current country
7-- sum(sum('Amount') is the total amount for ALL reps in the current country
8-- sum(Amount) / sum(sum('Amount') calculates the percentage that each rep contributed
9-- to the total amount in the current country
10((sum('Amount')/sum(sum('Amount'))
11
12
13-- [..] means "include all records in the partition"
14-- "by Billing_Country" means partition, or group, by country
15over ([..] partition by 'Billing_Country')) * 100) as 'Percent_AmountContribution',
16
17-- rank the percent contribution and partition by the country
18rank() over ([..] partition by ('Billing_Country') order by sum('Amount') desc ) as 'Rep_Rank';
19
20-- filter to include only the top 5 reps
21q = filter q by 'Rep_Rank' <=5;
The resulting graph shows the top-five reps in each country and displays each rep’s ranking.