We are thrilled to announce that Web Console is now Generally Available (GA)!
What is Web Console?
Web Console is a modern, browser-based IDE designed to help developers work faster inside the platform they already know, without switching tools just to inspect code, run queries, debug an issue, or make a quick fix. It’s built on a proven foundation of VS Code for the Web with our existing Salesforce Extensions for Visual Studio Code, delivering a seamless in-browser experience for Salesforce developers. This provides the robustness of a modern IDE in a fast, easy-to-access experience like you had with Developer Console. Yes, this is your modern alternative to Developer Console!
You may also be wondering about how Web Console differs from Agentforce Vibes IDE, since they are both dev environments accessible from the browser. In short, Web Console is a lightweight environment optimized for quick file editing and development tasks within a single org, while Agentforce Vibes IDE is a full development environment backed by a virtual machine (VM), providing additional compute, AI, integration capabilities, and multi-org connections. They really serve two different needs, and depending on what you’re looking to do you can select the appropriate tool for the job.
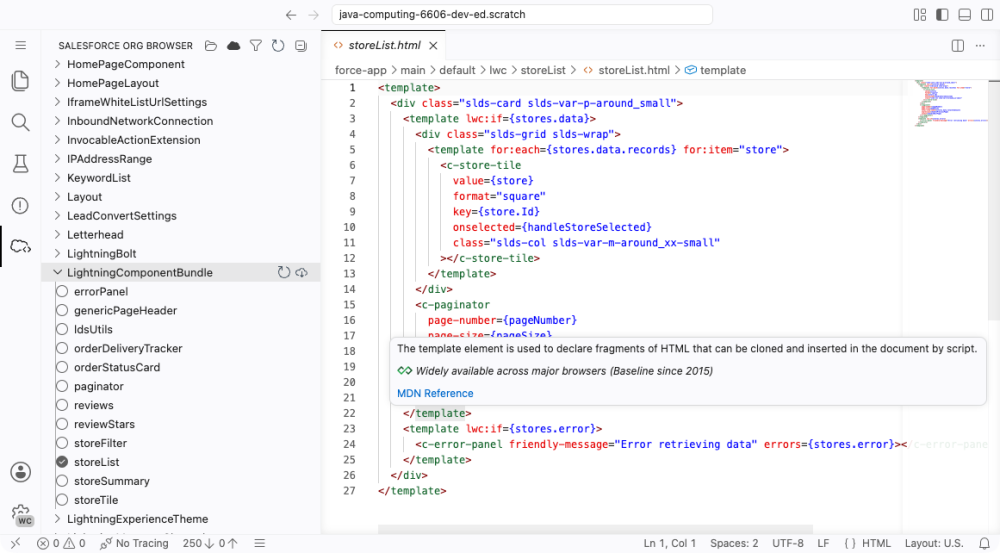
Web Console provides the same trusted functionality you’ve become accustomed to in Developer Console, but through a more modern experience. Additionally, Web Console provides new capabilities that have not been available in Developer Console, including support for Lightning Web Components (LWC).
Below is a table highlighting key capabilities of Web Console, with Quick Start instructions for using them in Web Console (and links to full documentation for each). A star indicates features you have access to in Web Console that you didn’t have access to in Developer Console.
| Feature/Capability | Quick Start – How to Access Web Console |
| Quick, in-context Apex viewing/editing |
|
| View/edit Lightning Web Component (LWC) files ⭐ |
|
| Run Anonymous Apex |
|
| Generate/run SOQL queries, optionally with declarative SOQL Builder ⭐, and optimize performance by generating a query plan |
|
| Run Apex tests and view test results |
|
| Debug Apex with trace flags and log levels | View Logs:
Trace/Log Levels
|
| Browse all metadata in the org ⭐, and optionally retrieve for editing/redeploy with the Org Browser |
|
| Log Analysis | Coming soon via Certinia Apex Log Analyzer! |
* To open Command Palette use Ctrl+Shift+P on Windows or Cmd+Shift+P on macOS.
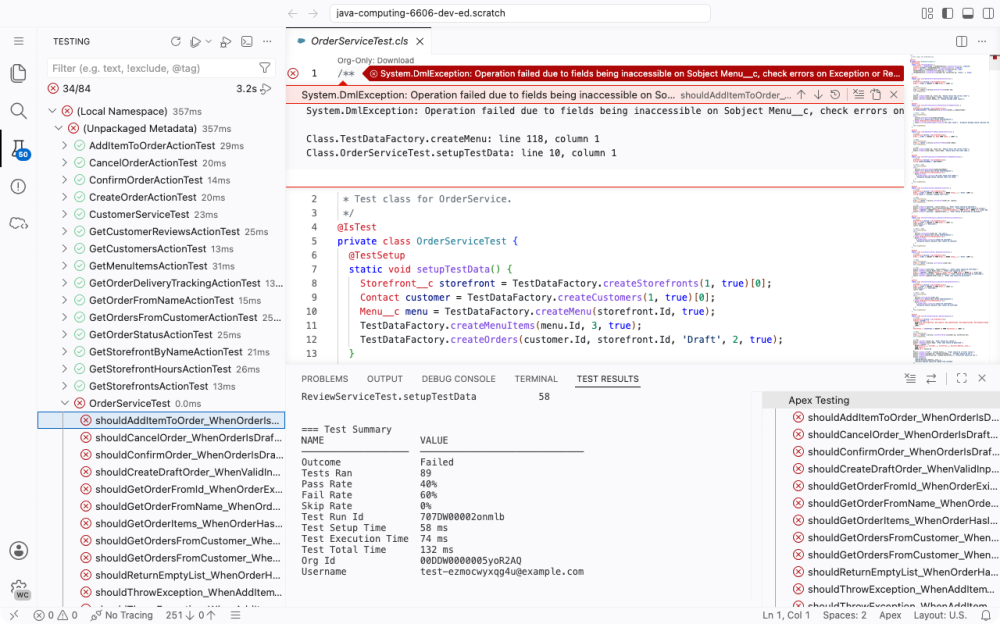
Connected workflow example: Debugging an Apex job failure
Apex job failures are a good example of where Web Console can make an immediate difference. A developer can begin in the Apex Jobs page, where a failed or long-running Apex job is already visible. From there, they can open the related Apex class in Web Console, enable logging, rerun the scenario, inspect the execution path, jump from the stack trace to the problematic line of code, make the fix, run tests, and validate that the job now completes successfully. They can do all of that without leaving Salesforce or bouncing between disconnected tools.
This streamlined flow is more efficient because it mirrors how real troubleshooting actually happens. The work does not begin in a file tree. It begins with a problem. Web Console is designed so the IDE meets the developer at that point of failure, then stays with them through diagnosis, code change, and validation.
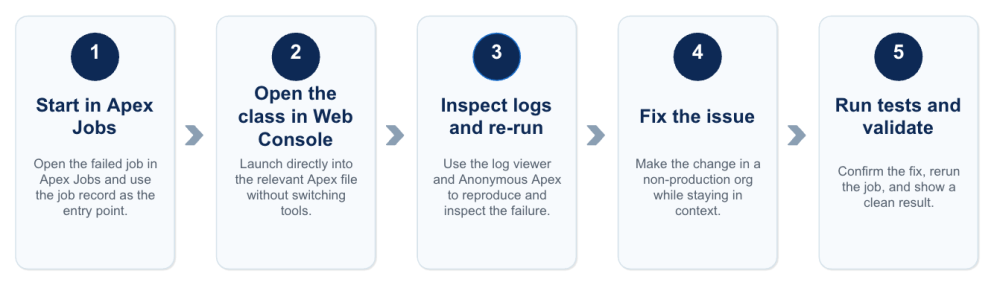
This is one of the clearest ways Web Console improves usability. Instead of forcing the developer to reconstruct the situation across separate tools, it keeps runtime evidence, source code, and validation steps close together, shortening the distance between “What just happened?” and “Did my fix resolve the issue?”
Production versus non-production: Web Console guardrails
Web Console is built with the realities of Salesforce development in mind. In production orgs, Apex editing is read-only, letting developers inspect and understand code safely without any risk to live orgs. In sandboxes and other non-production environments, developers can make inline edits and save changes as part of a faster path-to-fix workflow.
That balance is important. A modern experience should make developers faster, but not by weakening platform guardrails. Web Console keeps the guardrails intact while still streamlining inspection, debugging, and validation.
How to launch Web Console
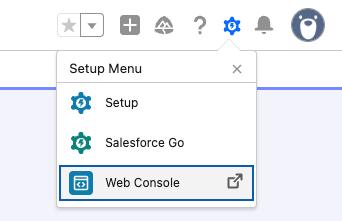
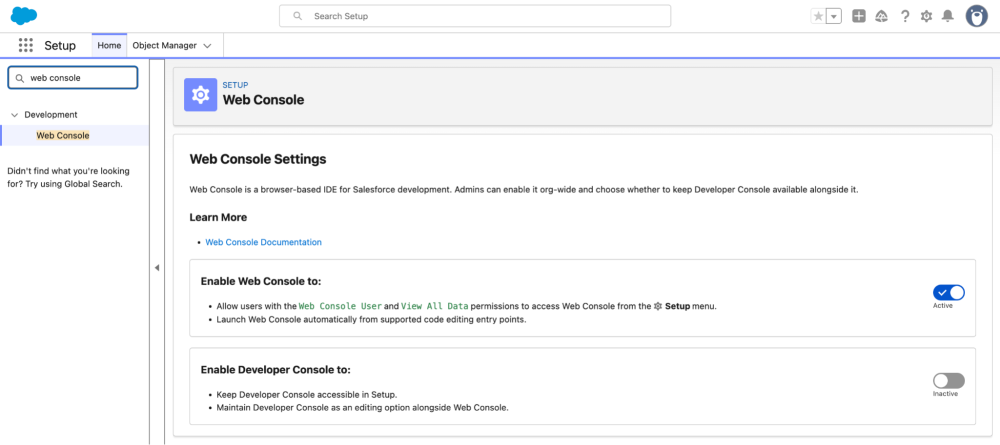
Web Console is now enabled by default for users with admin permissions. Getting started with Web Console requires no local command-line setup or extension installation. Once it is enabled, you can simply launch it directly from the Setup (gear) menu within your Salesforce org or refer to the official guide on How to launch Web Console. Global access can be disabled or enabled through Setup -> Development -> Web Console.
What about Developer Console?
While we believe that Web Console will provide you with the functionality that you need and an improved experience, if you still prefer to use Developer Console you can easily re-enable it through Setup -> Development -> Web Console, then toggle Enable Developer Console.
If you or your team find yourselves needing to revert to the legacy Developer Console, we would love to know why! Please share your feedback so we can ensure Web Console continues to satisfy all your development needs.
Conclusion
We’re excited to bring Web Console to general availability, providing a quick, easy, and streamlined experience for your everyday development needs. Whether it’s making a quick edit to an Apex class, modifying an LWC component, testing and debugging your code, querying data in your org, running an Apex script, or just browsing your org’s metadata, Web Console makes it easy.
And it’s only a click away: try Web Console today at Setup Menu (gear icon) -> Web Console!
Resources
- Web Console documentation
- Feedback/Issues repository on GitHub
- AMA: Oct 28, 2026 at 9 a.m. PT
About the author
Karen Fidelak is a Sr. Director Product Management at Salesforce, focused on bringing robust developer tooling and experiences to our developer community. She leads product teams responsible for our IDEs, VS Code extensions, CLI, Agentforce Vibes, DevOps Center, DX Inspector, and Code Analyzer. You can follow her on LinkedIn.