


 j
javg() or average()
count()
first()
last()
max()
median()
min()
sum()
unique()
stddev()
stddevp()
var()
varp()
percentile_cont()
percentile_disc()
regr_intercept()
regr_slope()
regr_r2()
grouping()
Windowing Functions
coalesce
Previous Versions
Calculates a percentile based on a continuous distribution of the column value.
1percentile_cont(p) within group (order by expr [asc | desc])percentile_cont() accepts a numeric grouped expression expr and sorts it in the specified order. If order is not specified, the default order is ascending. It returns the value behind which (100*p)% of values in the group fall in the sorted order, ignoring null values.
p can be any real numeric value between 0 and 1. expr can be any identifier, such as ‘xInt’ or ‘price’, but cannot be a complex expression, such as price/100 or ceil(distance), or a literal, such as 2.5.
If expr contains no value that falls exactly at the 100*p-th percentile mark, percentile_cont() returns a value interpolated from the two closest values in expr.
For example, if Mea1 contains the values [0, 1, 2, 3, 4, 5, 6, 7, 8, 9, 10, 11, 12, 13] then:
1percentile_cont(0.25) within group (order by Mea1 asc) = 3.25
2percentile_cont(0.25) within group (order by Mea1 desc) = 9.75
3percentile_cont(0) within group (order by Mea1 asc) = 0
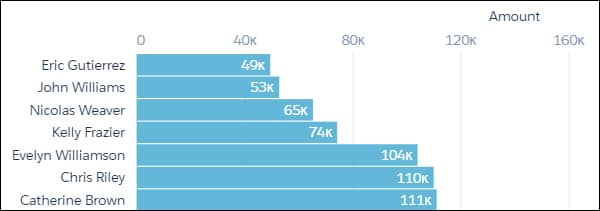
4percentile_cont(1) within group (order by Mea1 asc) = 13Suppose that you want to see the bottom 15% of deals for each rep. You don’t need to see the actual deal size - just the ‘average’ size of the bottom 15%. Use percentile_cont(.15).
See Also
j