


 j
javg() or average()
count()
first()
last()
max()
median()
min()
sum()
unique()
stddev()
stddevp()
var()
varp()
percentile_cont()
percentile_disc()
regr_intercept()
regr_slope()
regr_r2()
grouping()
Windowing Functions
coalesce
Previous Versions
Uses two numerical fields to calculate a trend line, then returns the slope. Use this function to learn more about the relationship between two numerical fields.
1regr_slope(field_y, field_x)field_y is a grouped dependent numeric expression and field_x is a grouped independent numeric expression. regr_slope(field_y, field_x) uses simple linear regression to calculate the trend line. The input fields (field_y, field_x) must contain at least two pairs of non-null values. This function works with simple grouped values but not with cogroups.
Suppose that you have a dataset that includes the number of activities (such as meetings) and the won opportunity amount.
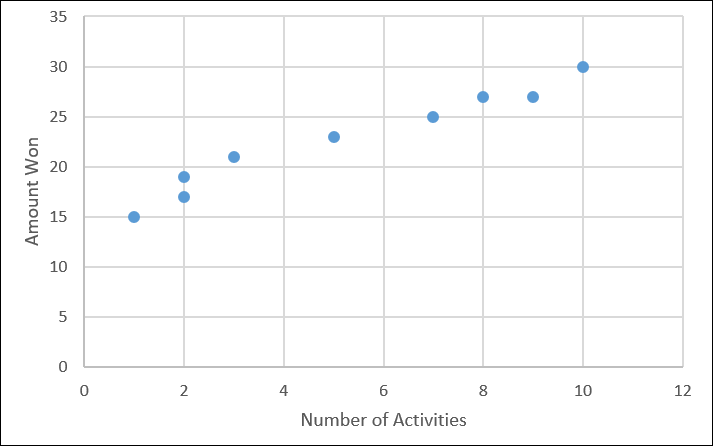
How much bigger will the deal size be for each extra activity? regr_slope performs a linear analysis on your data then calculates the slope (that is, the increased amount you win for each extra activity).
1q = load "data/sales";
2q = group q by all;
3
4--trunc() truncates the result to two decimal places
5q = foreach q generate trunc(regr_slope('Amount', 'NumActivities'),2) as 'Gain per Activity';
Based on your existing data, every extra activity that you have tends to increase the deal size by $1.45 million, on average.

See Also
j