


 j
javg() or average()
count()
first()
last()
max()
median()
min()
sum()
unique()
stddev()
stddevp()
var()
varp()
percentile_cont()
percentile_disc()
regr_intercept()
regr_slope()
regr_r2()
grouping()
Windowing Functions
coalesce
Previous Versions
Returns the value corresponding to the specified percentile.
1percentile_disc(p) within group (order by expr [asc | desc])percentile_disc() accepts a numeric grouped expression expr and sorts it in the specified order. If order is not specified, the default order is ascending. It returns the value behind which (100*p)% of values in the group fall in the sorted order, ignoring null values.
p can be any real numeric value between 0 and 1, and is accurate to 8 decimal places of precision. expr can be any identifier, such as ‘xInt’ or ‘price’, but cannot be a complex expression, such as price/100 or ceil(distance), or a literal, such as 2.5.
If expr contains no value that falls exactly at the 100*p-th percentile mark, percentile_disc() returns the next value from expr in the sort order.
For example, if Mea1 contains the values [54, 35, 15, 15, 76, 87, 78] then:
1percentile_disc(0.5) within group (order by Mea1) == 54
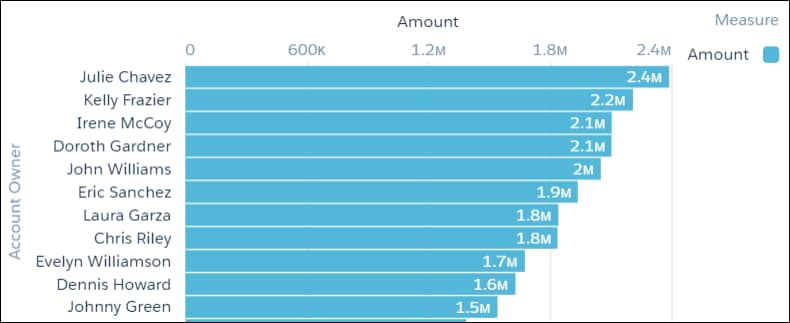
2percentile_disc(0.72) within group (order by Mea1) == 78Suppose that you want to see which reps close the biggest deals. (The result may be different than the sum of deal amount, if some reps close a lot of smaller deals). You also want the chart to display the size of actual deals, not an average of deal size. Use percentile_disc(.25) to look at the top quarter of the deal size for each rep.
1q = load "DTC_Opportunity_SAMPLE";
2q = group q by 'Account_Owner';
3q = foreach q generate 'Account_Owner' as 'Account_Owner', percentile_disc(0.25) within group (order by 'Amount' desc) as 'Amount';
4q = order q by 'Amount' desc;
You can see that 25% of Julie Chavez’s deals are bigger than $2.4 million, and 25% of Kelly Frazier’s deals are bigger than $2.2 million. You also know that Julie closed a deal worth$2.4 million, and that number isn’t an average.
See Also
j