


Salesforce Voice with Telephony Providers Implementation Guide
 j
jCustomer Alerts Dashboards
Salesforce provides two CloudWatch custom dashboards to monitor potential issues with
your contact center.
You can fine-tune these dashboards as necessary for your Voice implementation. To learn
how to customize dashboards, see Using Amazon CloudWatch dashboards in the Amazon
CloudWatch User Guide.
Salesforce Voice Connect Dashboard
The customer alerts dashboards apply to these telephony models:
- Salesforce Voice with Amazon Connect
- Salesforce Voice with Partner Telephony from Amazon Connect
The Salesforce Voice Connect Dashboard shows general activity associated with your Amazon Connect implementation.
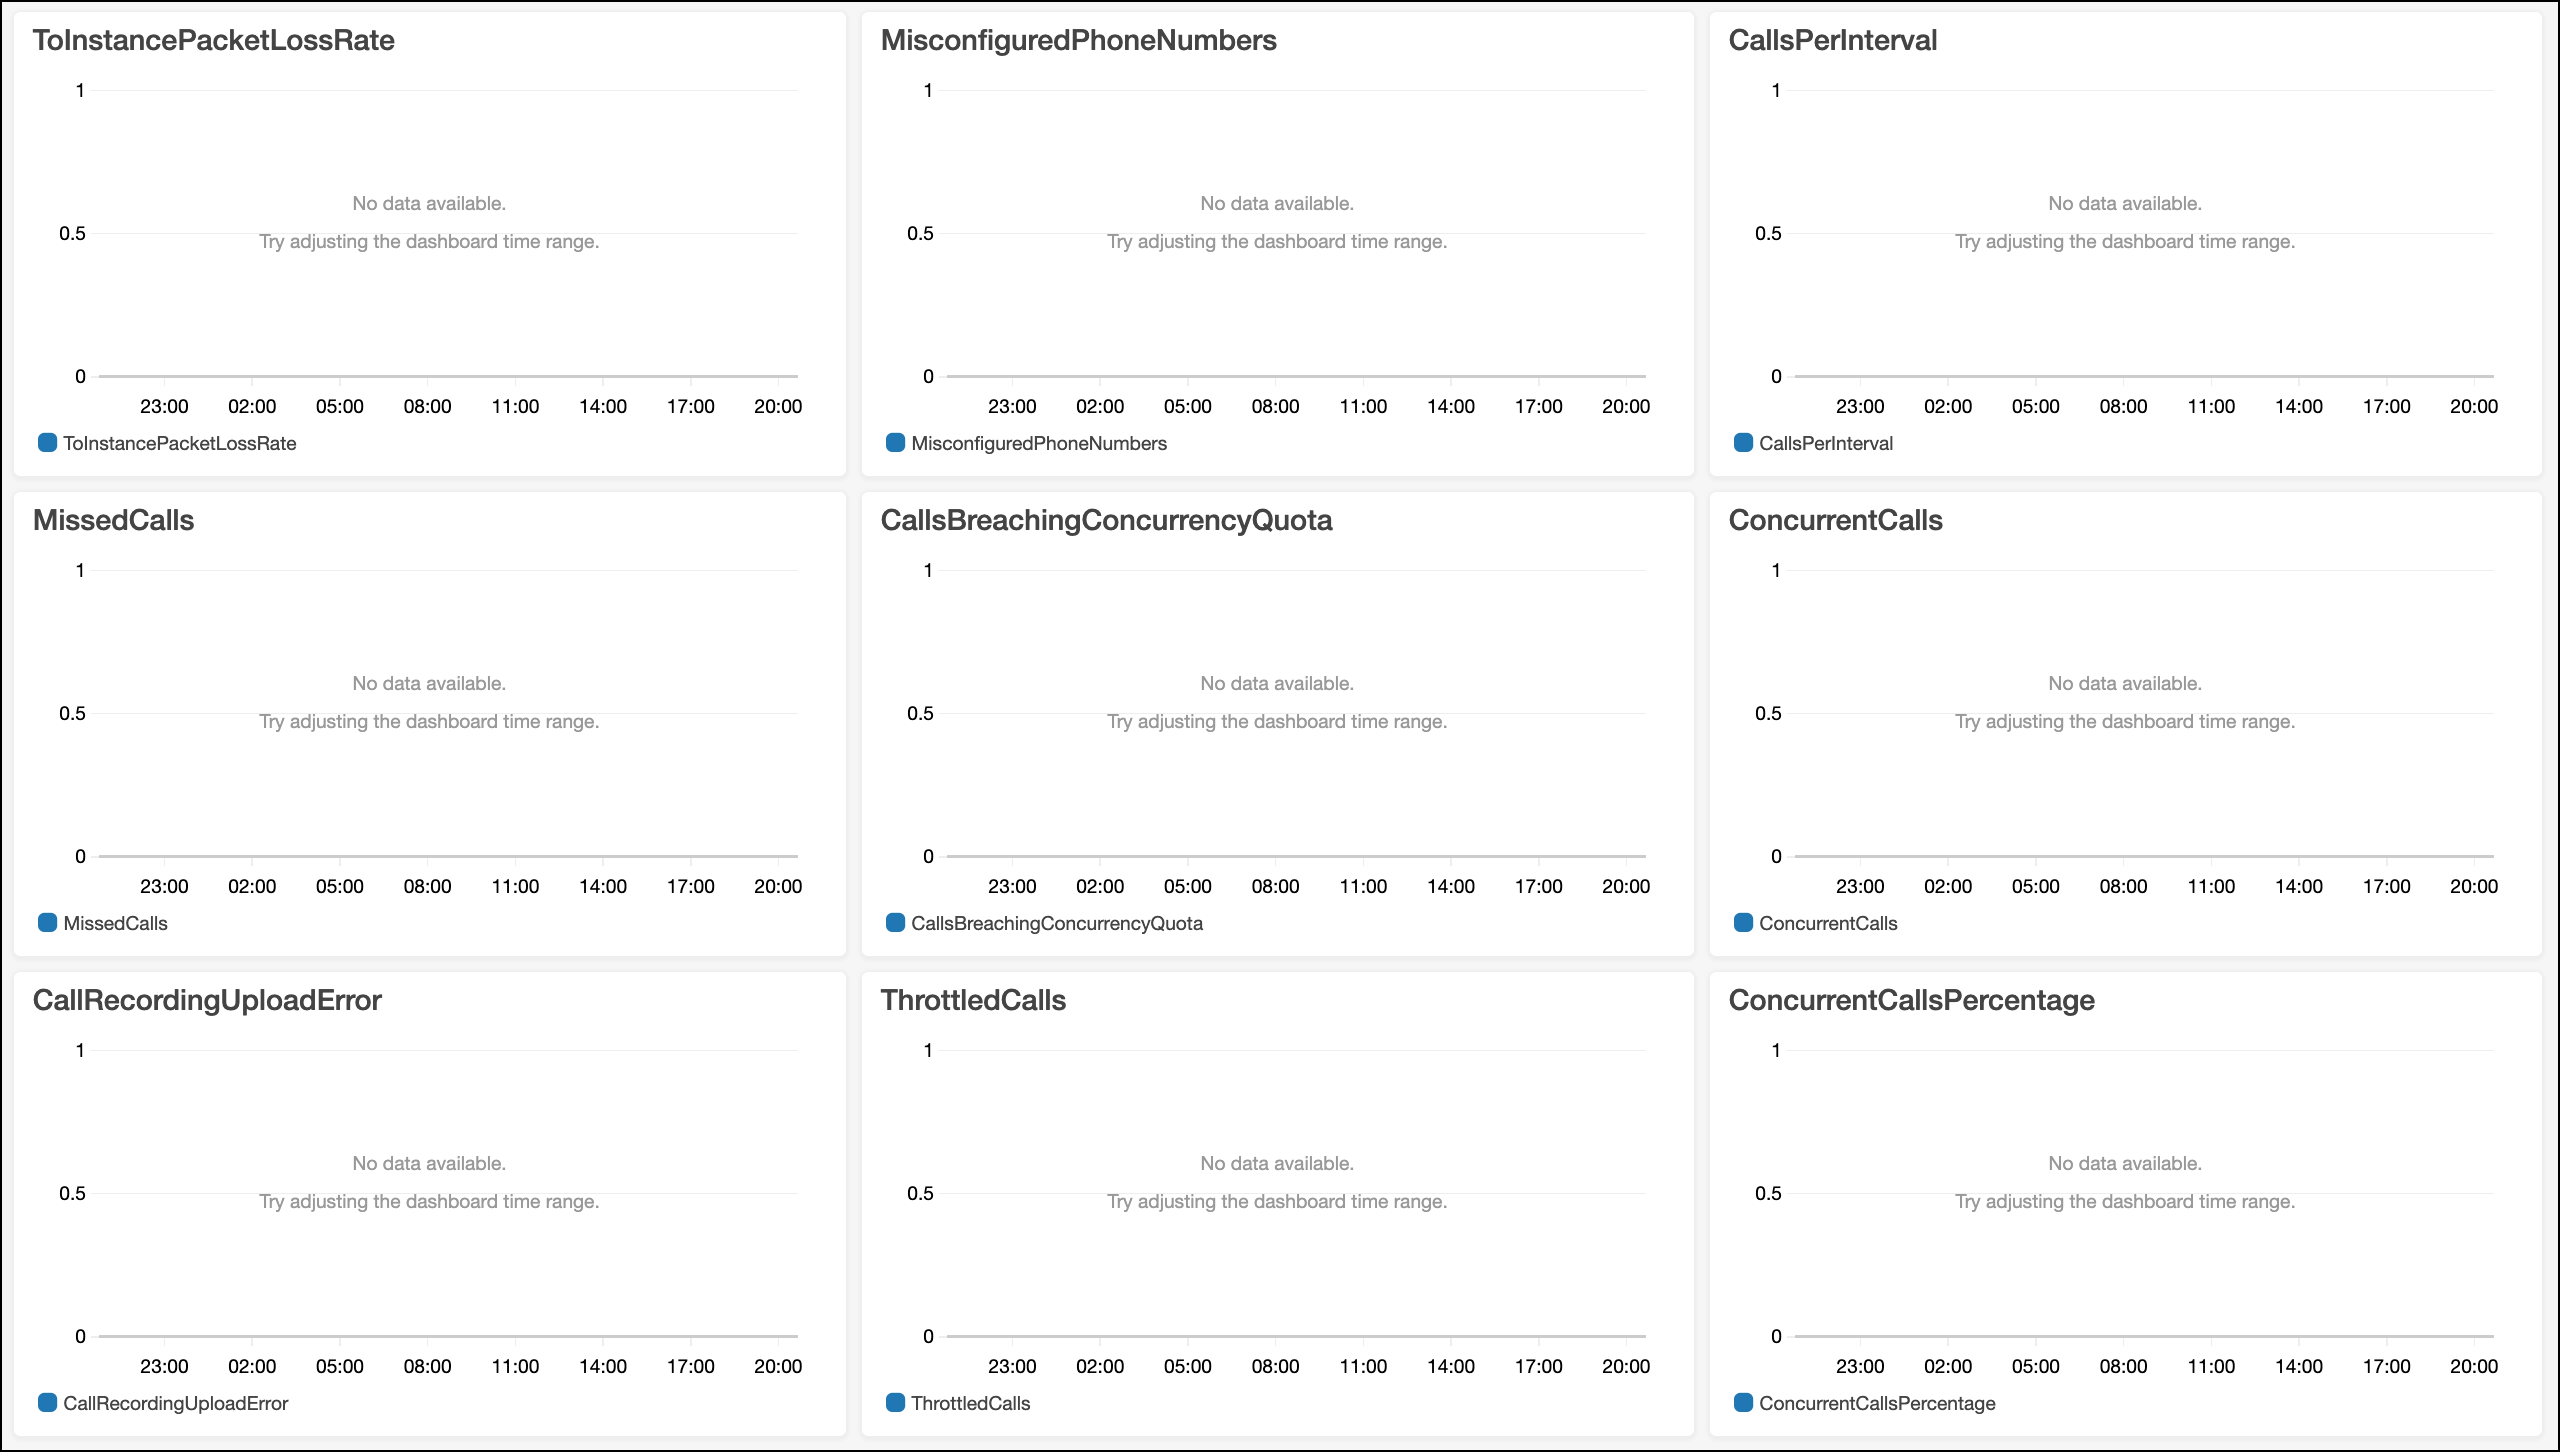
To learn what each of the metrics means, see Monitoring your instance using CloudWatch in the Amazon Connection Administrative Guide.
Salesforce Voice Lambda Dashboard
The Salesforce Voice Lambda Dashboard shows issues associated with the Lambda functions in your Amazon Connect instance.
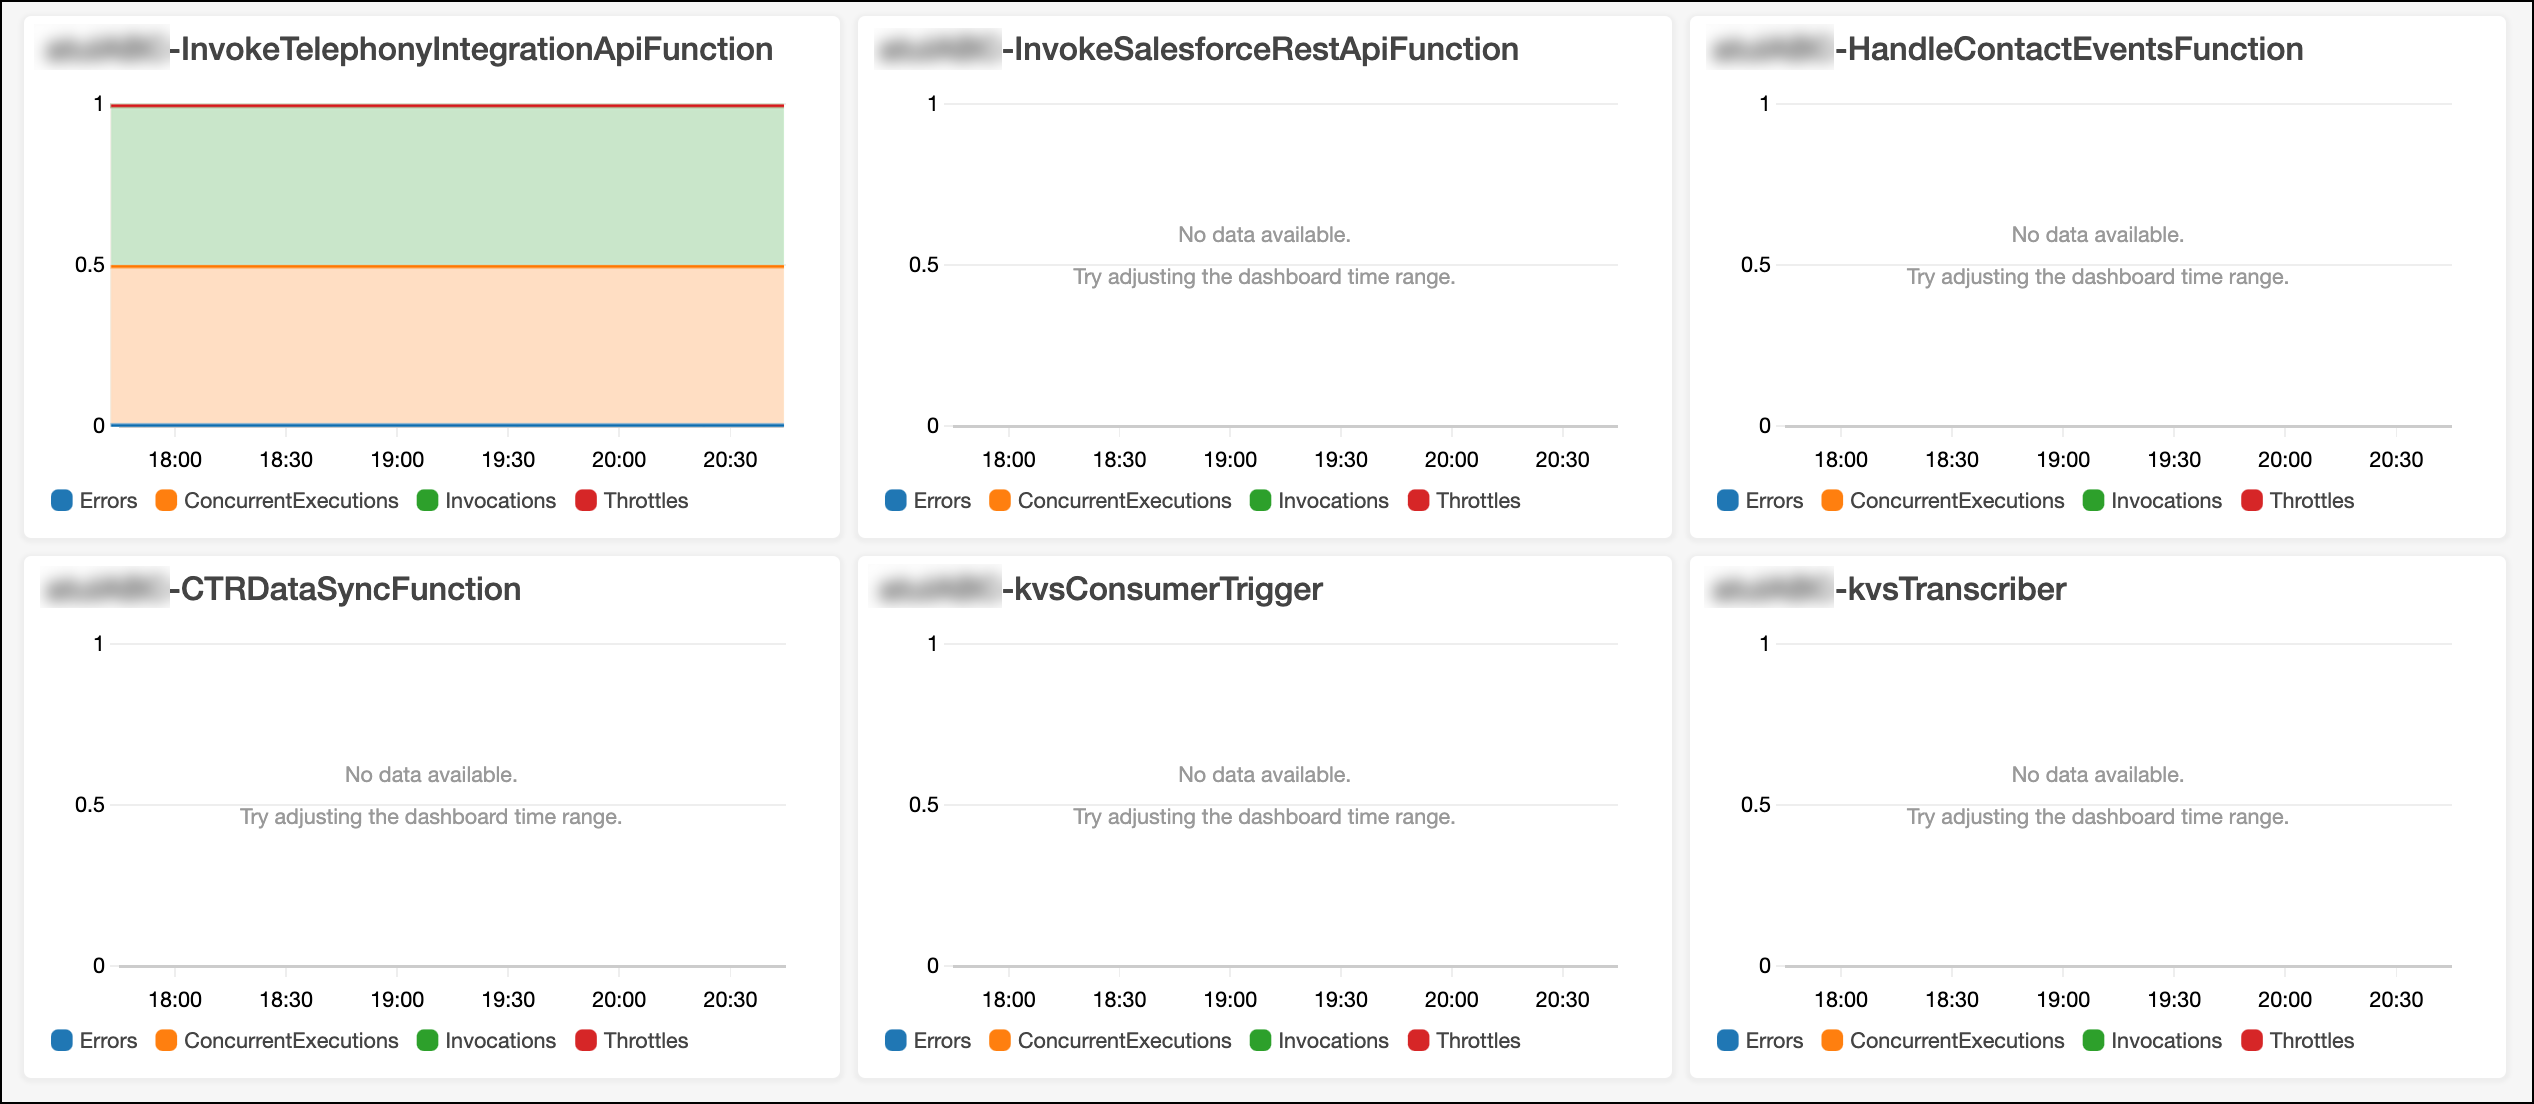
This dashboard tracks invocations, concurrent executions, and errors associated with each Lambda function.