Visualforce 開発者ガイド
 j
jその他の線形系列グラフ
その他の線形データ系列グラフには、面グラフ (<apex:areaSeries>)、折れ線グラフ (<apex:lineSeries>)、および散布図 (<apex:scatterSeries>) があります。
同じグラフで複数の線形データ系列グラフを組み合わせることができますが、わかりやすいグラフを作成するには、次の点に留意してください。
- データ系列グラフは、Visualforce マークアップで定義した���に重ねて描画される。
- 通常、<apex:barSeries> グラフは背景に表示する必要があり、透明にできないため、最初に定義する。
<apex:areaSeries> コンポーネントは積み上げ棒グラフと似ていますが、個々の棒の代わりに、系列の各点を線で結んで定義される網掛け領域として描画されます。<apex:areaSeries> を別のデータ系列と組み合わせるには、opacity 属性を使用して面グラフを部分的に透明にします。opacity 属性は、0.0 ~ 1.0 までの浮動小数点の数値です。0.0 は完全に透明、1.0 は完全に不透明を表します。棒グラフの系列と組み合わせた面グラフの系列を次に示します。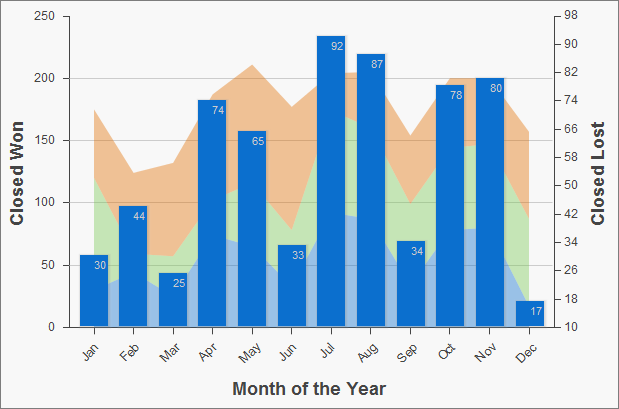
1<apex:chart height="400" width="700" animate="true" data="{!data}">
2    <apex:legend position="left"/>
3    <apex:axis type="Numeric" position="left" title="Closed Won" grid="true"
4        fields="data1,data2,data3">
5        <apex:chartLabel />
6    </apex:axis>
7    <apex:axis type="Numeric" position="right" fields="data1"
8        title="Closed Lost" />
9    <apex:axis type="Category" position="bottom" fields="name"
10        title="Month of the Year">
11        <apex:chartLabel rotate="315"/>
12    </apex:axis>
13    <apex:areaSeries axis="left" tips="true" opacity="0.4"
14        xField="name" yField="data1,data2,data3"/>
15    <apex:barSeries orientation="vertical" axis="right"
16        xField="name" yField="data1">
17        <apex:chartLabel display="insideEnd" field="data1" color="#333"/>
18    </apex:barSeries>
19</apex:chart>デフォルトでは、面グラフの凡例のタイトルには、yField 属性の項目の名前が使用されます。上の例では、デフォルトのタイトルは「data1」、「data2」、「data3」になります。凡例によりわかりやすいタイトルを付けるには、<apex:areaSeries> コンポーネントの title 属性を使用します。各項目はカンマで区切ります。たとえば、title="MacDonald,Promas,Worle" のように使用します。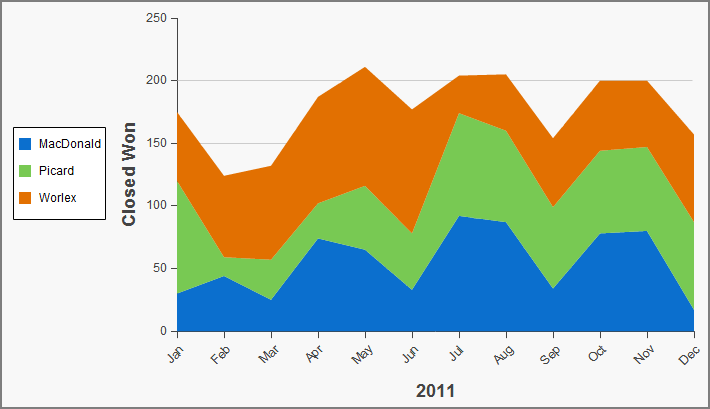
1<apex:chart height="400" width="700" animate="true" data="{!data}">
2    <apex:legend position="left"/>
3    <apex:axis type="Numeric" position="left" fields="data1,data2,data3"
4        title="Closed Won" grid="true">
5        <apex:chartLabel />
6    </apex:axis>
7    <apex:axis type="Category" position="bottom" fields="name" title="2011">
8        <apex:chartLabel rotate="315"/>
9    </apex:axis>
10    <apex:areaSeries axis="left" xField="name" tips="true"
11        yField="data1,data2,data3" title="MacDonald,Picard,Worlex"  />
12</apex:chart>
<apex:areaSeries> グラフと同様に、<apex:lineSeries> グラフでは一連の点を結ぶ線が使用されます。線の下の領域を塗りつぶすことができます。<apex:areaSeries> グラフとは違い、<apex:lineSeries> グラフは積み上げられません。<apex:lineSeries> グラフが塗りつぶされていない場合は、同じグラフに複数の系列を表示することができます。折れ線グラフの系列にはデータポイントのマーカーを表示でき、マーカーと結線の両方の色とサイズを定義できます。3 つの系列を組み合わせ、そのうちの 1 つが塗りつぶされている折れ線グラフを次に示します。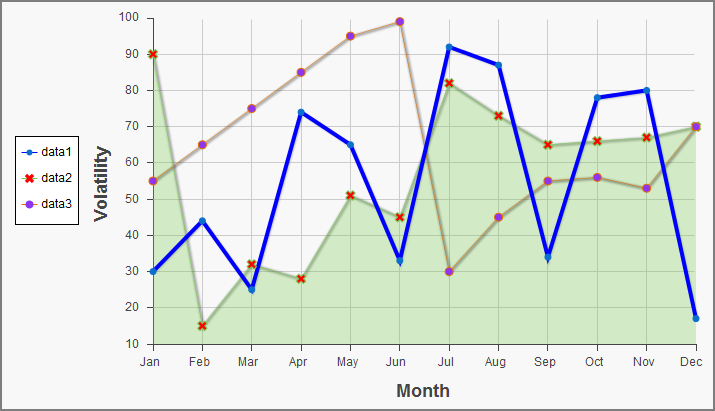
1<apex:chart height="400" width="700" animate="true" legend="true" data="{!data}">
2    <apex:legend position="left"/>
3    <apex:axis type="Numeric" position="left" title="Volatility" grid="true"
4        fields="data1,data2,data3">
5        <apex:chartLabel />
6    </apex:axis>
7    <apex:axis type="Category" position="bottom" title="Month" grid="true"
8        fields="name">
9        <apex:chartLabel />
10    </apex:axis>
11    <apex:lineSeries axis="left" xField="name" yField="data1"
12        strokeColor="#0000FF" strokeWidth="4"/>
13    <apex:lineSeries axis="left" fill="true" xField="name" yField="data2"
14        markerType="cross" markerSize="4" markerFill="#FF0000"/>
15    <apex:lineSeries axis="left" xField="name" yField="data3"
16        markerType="circle" markerSize="4" markerFill="#8E35EF">
17        <apex:chartTips height="20" width="120"/>
18    </apex:lineSeries>
19</apex:chart><apex:scatterSeries> グラフは、結線のない <apex:lineSeries> グラフのようなものです。さまざまなマーカーのサイズ、種類、色を使用することによって、同じグラフに多数の散布図系列を簡単に描画できます。