Analytics SAQL Developer Guide
 j
jregr_intercept()
Uses two numerical fields to calculate a trend line, then returns the y-intercept
value. Use this function to find out the likely value of field_y when
field_x is zero.
1regr_intercept(field_y, field_x)field_y is a grouped dependent numeric expression and field_x is a grouped independent numeric expression. regr_intercept(field_y, field_x) uses simple linear regression to calculate the trend line. The input fields (field_y, field_x) must contain at least two pairs of non-null values. This function works with simple grouped values but not with cogroups.
Example - What Is the Likely Amount Won If the Number of Activities Is Zero?
Suppose that you have a dataset that includes the number of activities (such as meetings) and the won opportunity amount.
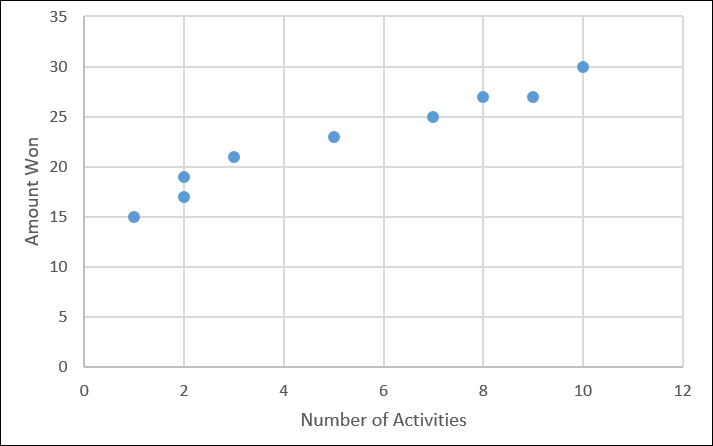
What size of deal can you expect to win if you don't have any activities with
an account? regr_intercept performs a
linear analysis on your data then calculates the y-intercept (that is, the
value of Amount Won when Number of Activities is
zero).
1q = load "Data";
2q = group q by all;
3
4--trunc() truncates the result to two decimal places
5q = foreach q generate trunc(regr_intercept('Amount', 'NumActivities'),2) as intercept;
The projected deal size with no activities is $15.04 million dollars.
